
Search for Indicators
Mental Health
Indicator Gauge Icon Legend
Legend Colors
Red is bad, green is good, blue is not statistically different/neutral.
Compared to Distribution
 the value is in the best half of communities.
 the value is in the 2nd worst quarter of communities.
 the value is in the worst quarter of communities.
Compared to Target
 meets target;
  does not meet target.
Compared to a Single Value
 lower than the comparison value;
 higher than the comparison value;
 not statistically different from comparison value.
Trend

 non-significant change over time;
 significant change over time;
  no change over time.
Compared to Prior Value
 higher than the previous measurement period;
 lower than the previous measurement period;
 no statistically different change from previous measurement period.
Health / Mental Health & Mental Disorders
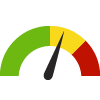
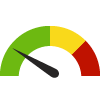
Adults Ever Diagnosed with Depression County: Kings
Adults Ever Diagnosed with Depression County: Kings
18.6%
(2021)
Compared to:
CA Counties
The distribution is based on data from 58 California counties.
U.S. Counties
The distribution is based on data from 3,074 U.S. counties and county equivalents.
US Value
(19.5%)
The regional value is compared to the national value.
Health / Mental Health & Mental Disorders
Adults Needing and Receiving Behavioral Health Care Services
Value
Compared to:
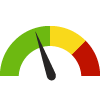
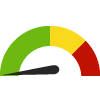
Adults Needing and Receiving Behavioral Health Care Services County: Kings
Adults Needing and Receiving Behavioral Health Care Services County: Kings
51.0%
(2021-2022)
Compared to:


CA Counties
The distribution is based on data from 58 California counties.
CA Value
(55.9%)
The regional value is compared to the California state value.
Prior Value
(55.2%)
Prior Value compares a measured value with the previously measured value. Confidence intervals were taken into account in determining the direction of the comparison.
Trend
This comparison measures the indicator’s values over multiple time periods.<br>The Mann-Kendall Test for Statistical Significance is used to evaluate the trend<br>over 4 to 10 periods of measure, subject to data availability and comparability.
Health / Mental Health & Mental Disorders
Adults who Bought Medications for Anxiety or Depression
Value
Compared to:
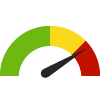
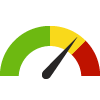
Adults who Bought Medications for Anxiety or Depression County: Kings
Adults who Bought Medications for Anxiety or Depression County: Kings
16.1%
(2023)
Compared to:


CA Value
(13.7%)
The regional value is compared to the California state value.
US Value
(14.9%)
The regional value is compared to the national value.
Prior Value
(16.0%)
Prior Value compares a measured value with the previously measured value. Confidence intervals were not taken into account in determining the direction of the comparison.
Health / Mental Health & Mental Disorders
Adults Who Ever Thought Seriously About Committing Suicide
Value
Compared to:
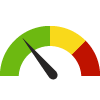
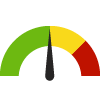
Adults Who Ever Thought Seriously About Committing Suicide County: Kings
Adults Who Ever Thought Seriously About Committing Suicide County: Kings
22.1%
(2021-2022)
Compared to:


CA Counties
The distribution is based on data from 58 California counties.
CA Value
(19.0%)
The regional value is compared to the California state value.
Prior Value
(17.4%)
Prior Value compares a measured value with the previously measured value. Confidence intervals were taken into account in determining the direction of the comparison.
Trend
This comparison measures the indicator’s values over multiple time periods.<br>The Mann-Kendall Test for Statistical Significance is used to evaluate the trend<br>over 4 to 10 periods of measure, subject to data availability and comparability.
Health / Mental Health & Mental Disorders
Adults who Feel Life is Slipping Out of Control
Value
Compared to:
Adults who Feel Life is Slipping Out of Control County: Kings
Adults who Feel Life is Slipping Out of Control County: Kings
27.9%
(2023)
Compared to:
CA Counties
The distribution is based on data from 58 California counties.
CA Value
(26.6%)
The regional value is compared to the California state value.
US Value
(26.7%)
The regional value is compared to the national value.
Prior Value
(30.7%)
Prior Value compares a measured value with the previously measured value. Confidence intervals were not taken into account in determining the direction of the comparison.
Health / Mental Health & Mental Disorders
Adults with Likely Serious Psychological Distress
Value
Compared to:
Adults with Likely Serious Psychological Distress County: Kings
Adults with Likely Serious Psychological Distress County: Kings
20.8%
(2021-2022)
Compared to:

CA Counties
The distribution is based on data from 58 California counties.
CA Value
(16.7%)
The regional value is compared to the California state value.
Prior Value
(16.5%)
Prior Value compares a measured value with the previously measured value. Confidence intervals were taken into account in determining the direction of the comparison.
Trend
This comparison measures the indicator’s values over multiple time periods.<br>The Mann-Kendall Test for Statistical Significance is used to evaluate the trend<br>over 4 to 10 periods of measure, subject to data availability and comparability.
Age-Adjusted Death Rate due to Suicide County: Kings
Age-Adjusted Death Rate due to Suicide County: Kings
14.2
Deaths per 100,000 population
(2018-2020)
Compared to:
CA Counties
The distribution is based on data from 47 California counties.
U.S. Counties
The distribution is based on data from 1,307 U.S. counties and county equivalents.
CA Value
(10.5)
The regional value is compared to the California state value.
US Value
(13.9)
The regional value is compared to the national value.
Prior Value
(15.6)
Prior Value compares a measured value with the previously measured value. Confidence intervals were taken into account in determining the direction of the comparison.
Trend
This comparison measures the indicator’s values over multiple time periods.<br>The Mann-Kendall Test for Statistical Significance is used to evaluate the trend<br>over 4 to 10 periods of measure, subject to data availability and comparability.
HP 2030 Target
(12.8)
<div>MHMD-01: Reduce the suicide rate <strong>(LEADING HEALTH INDICATOR)</strong></div>
Health / Mental Health & Mental Disorders
Alzheimer's Disease or Dementia: Medicare Population
Value
Compared to:
Alzheimer's Disease or Dementia: Medicare Population County: Kings
Alzheimer's Disease or Dementia: Medicare Population County: Kings
6.0%
(2022)
Compared to:
CA Counties
The distribution is based on data from 58 California counties.
U.S. Counties
The distribution is based on data from 3,129 U.S. counties and county equivalents.
CA Value
(5.0%)
The regional value is compared to the California state value.
US Value
(6.0%)
The regional value is compared to the national value.
Prior Value
(6.0%)
Prior Value compares a measured value with the previously measured value. Confidence intervals were not taken into account in determining the direction of the comparison.
Trend
This comparison measures the indicator’s values over multiple time periods.<br>The Mann-Kendall Test for Statistical Significance is used to evaluate the trend<br>over 4 to 10 periods of measure, subject to data availability and comparability.
Depression: Medicare Population County: Kings
Depression: Medicare Population County: Kings
11.0%
(2022)
Compared to:
CA Counties
The distribution is based on data from 58 California counties.
U.S. Counties
The distribution is based on data from 3,129 U.S. counties and county equivalents.
CA Value
(14.0%)
The regional value is compared to the California state value.
US Value
(16.0%)
The regional value is compared to the national value.
Prior Value
(11.0%)
Prior Value compares a measured value with the previously measured value. Confidence intervals were not taken into account in determining the direction of the comparison.
Trend
This comparison measures the indicator’s values over multiple time periods.<br>The Mann-Kendall Test for Statistical Significance is used to evaluate the trend<br>over 4 to 10 periods of measure, subject to data availability and comparability.
Frequent Mental Distress County: Kings
Frequent Mental Distress County: Kings
14.1%
(2019)
Compared to:
CA Counties
The distribution is based on data from 58 California counties.
U.S. Counties
The distribution is based on data from 3,121 U.S. counties and county equivalents.
CA Value
(12.0%)
The regional value is compared to the California state value.
US Value
(14.0%)
The regional value is compared to the national value.
Prior Value
(15.0%)
Prior Value compares a measured value with the previously measured value. Confidence intervals were taken into account in determining the direction of the comparison.
Health / Mental Health & Mental Disorders
Households that Received Mental Healthcare Services
Value
Compared to:
Households that Received Mental Healthcare Services County: Kings
Households that Received Mental Healthcare Services County: Kings
9.7%
(2023)
Compared to:

CA Value
(9.5%)
The regional value is compared to the California state value.
US Value
(8.8%)
The regional value is compared to the national value.
Prior Value
(9.0%)
Prior Value compares a measured value with the previously measured value. Confidence intervals were not taken into account in determining the direction of the comparison.
Trend
This comparison measures the indicator’s values over multiple time periods.<br>The Mann-Kendall Test for Statistical Significance is used to evaluate the trend<br>over 4 to 10 periods of measure, subject to data availability and comparability.
Mental Health Provider Rate County: Kings
Mental Health Provider Rate County: Kings
236
Providers per 100,000 population
(2023)
Compared to:
CA Counties
The distribution is based on data from 58 California counties.
U.S. Counties
The distribution is based on data from 2,956 U.S. counties and county equivalents.
CA Value
(450)
The regional value is compared to the California state value.
Prior Value
(224)
Prior Value compares a measured value with the previously measured value. Confidence intervals were not taken into account in determining the direction of the comparison.
Trend
This comparison measures the indicator’s values over multiple time periods.<br>The Mann-Kendall Test for Statistical Significance is used to evaluate the trend<br>over 4 to 10 periods of measure, subject to data availability and comparability.
Persons with a Cognitive Difficulty County: Kings
Persons with a Cognitive Difficulty County: Kings
5.4%
(2018-2022)
Compared to:
CA Value
(4.6%)
The regional value is compared to the California state value.
US Value
(5.3%)
The regional value is compared to the national value.
Trend
This comparison measures the indicator’s values over multiple time periods.<br>The Mann-Kendall Test for Statistical Significance is used to evaluate the trend<br>over 4 to 10 periods of measure, subject to data availability and comparability.
Poor Mental Health: 14+ Days County: Kings
Poor Mental Health: 14+ Days County: Kings
17.4%
(2021)
Compared to:
CA Counties
The distribution is based on data from 58 California counties.
U.S. Counties
The distribution is based on data from 3,074 U.S. counties and county equivalents.
US Value
(14.7%)
The regional value is compared to the national value.
Health / Mental Health & Mental Disorders
Poor Mental Health: Average Number of Days
Value
Compared to:
Poor Mental Health: Average Number of Days County: Kings
Poor Mental Health: Average Number of Days County: Kings
5.2
Days
(2021)
Compared to:
CA Counties
The distribution is based on data from 58 California counties.
U.S. Counties
The distribution is based on data from 3,141 U.S. counties and county equivalents.
CA Value
(4.7)
The regional value is compared to the California state value.
US Value
(4.8)
The regional value is compared to the national value.
Prior Value
(4.8)
Prior Value compares a measured value with the previously measured value. Confidence intervals were taken into account in determining the direction of the comparison.
Trend
This comparison measures the indicator’s values over multiple time periods.<br>The Mann-Kendall Test for Statistical Significance is used to evaluate the trend<br>over 4 to 10 periods of measure, subject to data availability and comparability.
Health / Mental Health & Mental Disorders
Respondents who Agreed Suicide has Seriously Affected Their Lives
Value
Compared to:
Respondents who Agreed Suicide has Seriously Affected Their Lives County: Kings
Respondents who Agreed Suicide has Seriously Affected Their Lives County: Kings
34.9%
(2023)
Compared to:

Prior Value
(11.7%)
Prior Value compares a measured value with the previously measured value. Confidence intervals were not taken into account in determining the direction of the comparison.
Kings County 2023 Target
(9.9%)
Health / Mental Health & Mental Disorders
Respondents who are Able to Access Mental Health Services
Value
Compared to:
Respondents who are Able to Access Mental Health Services County: Kings
Respondents who are Able to Access Mental Health Services County: Kings
70.9%
(2023)
Compared to:
Prior Value
(55.2%)
Prior Value compares a measured value with the previously measured value. Confidence intervals were not taken into account in determining the direction of the comparison.
Health / Mental Health & Mental Disorders
Respondents who are Able to Access Telehealth Services
Value
Compared to:
Respondents who are Able to Access Telehealth Services County: Kings
Respondents who are Able to Access Telehealth Services County: Kings
79.9%
(2023)
Compared to:
Prior Value
(31.7%)
Prior Value compares a measured value with the previously measured value. Confidence intervals were not taken into account in determining the direction of the comparison.
Health / Mental Health & Mental Disorders
Respondents who are aware of 2-1-1 resources
Value
Compared to:
Respondents who are aware of 2-1-1 resources County: Kings
Respondents who are aware of 2-1-1 resources County: Kings
12.6%
(2023)
Compared to:

Prior Value
(25.7%)
Prior Value compares a measured value with the previously measured value. Confidence intervals were not taken into account in determining the direction of the comparison.
Health / Mental Health & Mental Disorders
Respondents who are aware of Champions resources
Value
Compared to:
Respondents who are aware of Champions resources County: Kings
Respondents who are aware of Champions resources County: Kings
25.9%
(2023)
Compared to:
Prior Value
(12.9%)
Prior Value compares a measured value with the previously measured value. Confidence intervals were not taken into account in determining the direction of the comparison.
Health / Mental Health & Mental Disorders
Respondents who are aware of church or spiritual community resources
Value
Compared to:
Respondents who are aware of church or spiritual community resources County: Kings
Respondents who are aware of church or spiritual community resources County: Kings
41.4%
(2023)
Compared to:
Prior Value
(35.6%)
Prior Value compares a measured value with the previously measured value. Confidence intervals were not taken into account in determining the direction of the comparison.
Health / Mental Health & Mental Disorders
Respondents who are aware of emergency room resources
Value
Compared to:
Respondents who are aware of emergency room resources County: Kings
Respondents who are aware of emergency room resources County: Kings
28.4%
(2023)
Compared to:
Prior Value
(38.6%)
Prior Value compares a measured value with the previously measured value. Confidence intervals were not taken into account in determining the direction of the comparison.
Health / Mental Health & Mental Disorders
Respondents who are aware of Kings County Behavioral Health resources
Value
Compared to:
Respondents who are aware of Kings County Behavioral Health resources County: Kings
Respondents who are aware of Kings County Behavioral Health resources County: Kings
43.2%
(2023)
Compared to:
Prior Value
(38.6%)
Prior Value compares a measured value with the previously measured value. Confidence intervals were not taken into account in determining the direction of the comparison.
Health / Mental Health & Mental Disorders
Respondents who are aware of Kings View resources
Value
Compared to:
Respondents who are aware of Kings View resources County: Kings
Respondents who are aware of Kings View resources County: Kings
33.5%
(2023)
Compared to:
Prior Value
(36.6%)
Prior Value compares a measured value with the previously measured value. Confidence intervals were not taken into account in determining the direction of the comparison.
Health / Mental Health & Mental Disorders
Respondents who are aware of the suicide hotline resources
Value
Compared to:
Respondents who are aware of the suicide hotline resources County: Kings
Respondents who are aware of the suicide hotline resources County: Kings
42.1%
(2023)
Compared to:
Prior Value
(57.4%)
Prior Value compares a measured value with the previously measured value. Confidence intervals were not taken into account in determining the direction of the comparison.
Health / Mental Health & Mental Disorders
Respondents who are aware of urgent care resources
Value
Compared to:
Respondents who are aware of urgent care resources County: Kings
Respondents who are aware of urgent care resources County: Kings
35.6%
(2023)
Compared to:
Prior Value
(34.7%)
Prior Value compares a measured value with the previously measured value. Confidence intervals were not taken into account in determining the direction of the comparison.
Health / Mental Health & Mental Disorders
Respondents who are aware of Warm Line resources
Value
Compared to:
Respondents who are aware of Warm Line resources County: Kings
Respondents who are aware of Warm Line resources County: Kings
31.3%
(2023)
Compared to:
Prior Value
(15.8%)
Prior Value compares a measured value with the previously measured value. Confidence intervals were not taken into account in determining the direction of the comparison.
Health / Mental Health & Mental Disorders
Respondents who are unable to access mental health services due to a lack of childcare
Value
Compared to:
Respondents who are unable to access mental health services due to a lack of childcare County: Kings
Respondents who are unable to access mental health services due to a lack of childcare County: Kings
20.4%
(2023)
Compared to:
Prior Value
(6.8%)
Prior Value compares a measured value with the previously measured value. Confidence intervals were not taken into account in determining the direction of the comparison.
Health / Mental Health & Mental Disorders
Respondents who are unable to access mental health services due to an inability to find a provider
Value
Compared to:
Respondents who are unable to access mental health services due to an inability to find a provider County: Kings
Respondents who are unable to access mental health services due to an inability to find a provider County: Kings
37.9%
(2023)
Compared to:
Prior Value
(45.8%)
Prior Value compares a measured value with the previously measured value. Confidence intervals were not taken into account in determining the direction of the comparison.
Health / Mental Health & Mental Disorders
Respondents who are unable to access mental health services due to finances
Value
Compared to:
Respondents who are unable to access mental health services due to finances County: Kings
Respondents who are unable to access mental health services due to finances County: Kings
34.5%
(2023)
Compared to:
Prior Value
(13.6%)
Prior Value compares a measured value with the previously measured value. Confidence intervals were not taken into account in determining the direction of the comparison.
Health / Mental Health & Mental Disorders
Respondents who are unable to access mental health services due to having no insurance
Value
Compared to:
Respondents who are unable to access mental health services due to having no insurance County: Kings
Respondents who are unable to access mental health services due to having no insurance County: Kings
21.8%
(2023)
Compared to:
Prior Value
(25.4%)
Prior Value compares a measured value with the previously measured value. Confidence intervals were not taken into account in determining the direction of the comparison.
Health / Mental Health & Mental Disorders
Respondents who are unable to access mental health services due to lack of transportation
Value
Compared to:
Respondents who are unable to access mental health services due to lack of transportation County: Kings
Respondents who are unable to access mental health services due to lack of transportation County: Kings
26.2%
(2023)
Compared to:
Prior Value
(3.4%)
Prior Value compares a measured value with the previously measured value. Confidence intervals were not taken into account in determining the direction of the comparison.
Health / Mental Health & Mental Disorders
Respondents who are unable to access mental health services due to not being covered by insurance
Value
Compared to:
Respondents who are unable to access mental health services due to not being covered by insurance County: Kings
Respondents who are unable to access mental health services due to not being covered by insurance County: Kings
10.7%
(2023)
Compared to:
Prior Value
(25.4%)
Prior Value compares a measured value with the previously measured value. Confidence intervals were not taken into account in determining the direction of the comparison.
Health / Mental Health & Mental Disorders
Respondents who are unable to access mental health services due to provider hours
Value
Compared to:
Respondents who are unable to access mental health services due to provider hours County: Kings
Respondents who are unable to access mental health services due to provider hours County: Kings
33.0%
(2023)
Compared to:
Prior Value
(13.6%)
Prior Value compares a measured value with the previously measured value. Confidence intervals were not taken into account in determining the direction of the comparison.
Health / Mental Health & Mental Disorders
Respondents who are unable to access mental health services due to stigma
Value
Compared to:
Respondents who are unable to access mental health services due to stigma County: Kings
Respondents who are unable to access mental health services due to stigma County: Kings
22.8%
(2023)
Compared to:
Prior Value
(13.6%)
Prior Value compares a measured value with the previously measured value. Confidence intervals were not taken into account in determining the direction of the comparison.
Health / Mental Health & Mental Disorders
Respondents Who Have Experienced an Increase in Mental Health Symptoms in Past Two Years
Value
Compared to:
Respondents Who Have Experienced an Increase in Mental Health Symptoms in Past Two Years County: Kings
Respondents Who Have Experienced an Increase in Mental Health Symptoms in Past Two Years County: Kings
60.3%
(2023)
Compared to:
Prior Value
(47.9%)
Prior Value compares a measured value with the previously measured value. Confidence intervals were not taken into account in determining the direction of the comparison.
No Comparison Data Available
(0%)
Health / Mental Health & Mental Disorders
Respondents who have experienced increased mental health symptoms but do not know where to receive mental health care
Value
Compared to:
Respondents who have experienced increased mental health symptoms but do not know where to receive mental health care County: Kings
Respondents who have experienced increased mental health symptoms but do not know where to receive mental health care County: Kings
22.9%
(2023)
Compared to:
Prior Value
(24.4%)
Prior Value compares a measured value with the previously measured value. Confidence intervals were not taken into account in determining the direction of the comparison.
Health / Mental Health & Mental Disorders
Respondents who have experienced increased mental health symptoms but have not received mental health care
Value
Compared to:
Respondents who have experienced increased mental health symptoms but have not received mental health care County: Kings
Respondents who have experienced increased mental health symptoms but have not received mental health care County: Kings
40.5%
(2023)
Compared to:
Prior Value
(61.4%)
Prior Value compares a measured value with the previously measured value. Confidence intervals were not taken into account in determining the direction of the comparison.
Health / Mental Health & Mental Disorders
Respondents who have increased mental health symptoms due to the COVID-19 pandemic
Value
Compared to:
Respondents who have increased mental health symptoms due to the COVID-19 pandemic County: Kings
Respondents who have increased mental health symptoms due to the COVID-19 pandemic County: Kings
57.2%
(2023)
Compared to:
Prior Value
(55.2%)
Prior Value compares a measured value with the previously measured value. Confidence intervals were not taken into account in determining the direction of the comparison.
Health / Mental Health & Mental Disorders
Respondents who Have Used Mental Health Services in the Community
Value
Compared to:
Respondents who Have Used Mental Health Services in the Community County: Kings
Respondents who Have Used Mental Health Services in the Community County: Kings
30.9%
(2023)
Compared to:
Prior Value
(14.1%)
Prior Value compares a measured value with the previously measured value. Confidence intervals were not taken into account in determining the direction of the comparison.
Trend
This comparison measures the indicator’s values over multiple time periods.<br>The Mann-Kendall Test for Statistical Significance is used to evaluate the trend<br>over 4 to 10 periods of measure, subject to data availability and comparability.
