
Search for Indicators
Healthy Eating
Indicator Gauge Icon Legend
Legend Colors
Red is bad, green is good, blue is not statistically different/neutral.
Compared to Distribution
 the value is in the best half of communities.
 the value is in the 2nd worst quarter of communities.
 the value is in the worst quarter of communities.
Compared to Target
 meets target;
  does not meet target.
Compared to a Single Value
 lower than the comparison value;
 higher than the comparison value;
 not statistically different from comparison value.
Trend

 non-significant change over time;
 significant change over time;
  no change over time.
Compared to Prior Value
 higher than the previous measurement period;
 lower than the previous measurement period;
 no statistically different change from previous measurement period.
Health / Nutrition & Healthy Eating
Adults Receiving Food Stamp Benefits County: Kings
Adults Receiving Food Stamp Benefits County: Kings
37.3%
(2022)
Compared to:
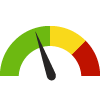
CA Counties
The distribution is based on data from 58 California counties.
CA Value
(31.7%)
The regional value is compared to the California state value.
Prior Value
(29.2%)
Prior Value compares a measured value with the previously measured value. Confidence intervals were taken into account in determining the direction of the comparison.
Trend
This comparison measures the indicator’s values over multiple time periods.<br>The Mann-Kendall Test for Statistical Significance is used to evaluate the trend<br>over 4 to 10 periods of measure, subject to data availability and comparability.
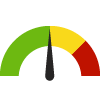
Adults who Drink Sugar-Sweetened Beverages County: Kings
Adults who Drink Sugar-Sweetened Beverages County: Kings
23.7%
(2021-2022)
Compared to:

CA Value
(14.6%)
The regional value is compared to the California state value.
Prior Value
(23.9%)
Prior Value compares a measured value with the previously measured value. Confidence intervals were taken into account in determining the direction of the comparison.
Trend
This comparison measures the indicator’s values over multiple time periods.<br>The Mann-Kendall Test for Statistical Significance is used to evaluate the trend<br>over 4 to 10 periods of measure, subject to data availability and comparability.
Adults who Frequently Cook Meals at Home County: Kings
Adults who Frequently Cook Meals at Home County: Kings
72.9%
(2023)
Compared to:

CA Counties
The distribution is based on data from 58 California counties.
CA Value
(78.2%)
The regional value is compared to the California state value.
US Value
(78.0%)
The regional value is compared to the national value.
Prior Value
(66.1%)
Prior Value compares a measured value with the previously measured value. Confidence intervals were not taken into account in determining the direction of the comparison.
Health / Nutrition & Healthy Eating
Adults Who Frequently Used Quick Service Restaurants: Past 30 Days
Value
Compared to:
Adults Who Frequently Used Quick Service Restaurants: Past 30 Days County: Kings
Adults Who Frequently Used Quick Service Restaurants: Past 30 Days County: Kings
44.6%
(2023)
Compared to:

CA Counties
The distribution is based on data from 58 California counties.
U.S. Counties
The distribution is based on data from 3,141 U.S. counties and county equivalents.
CA Value
(40.9%)
The regional value is compared to the California state value.
US Value
(40.4%)
The regional value is compared to the national value.
Prior Value
(44.9%)
Prior Value compares a measured value with the previously measured value. Confidence intervals were not taken into account in determining the direction of the comparison.
Trend
This comparison measures the indicator’s values over multiple time periods.<br>The Mann-Kendall Test for Statistical Significance is used to evaluate the trend<br>over 4 to 10 periods of measure, subject to data availability and comparability.
Child and Teen Fruit Consumption County: Kings
Child and Teen Fruit Consumption County: Kings
57.3%
(2019-2020)
Compared to:
CA Counties
The distribution is based on data from 58 California counties.
CA Value
(69.8%)
The regional value is compared to the California state value.
Prior Value
(60.9%)
Prior Value compares a measured value with the previously measured value. Confidence intervals were taken into account in determining the direction of the comparison.
Trend
This comparison measures the indicator’s values over multiple time periods.<br>The Mann-Kendall Test for Statistical Significance is used to evaluate the trend<br>over 4 to 10 periods of measure, subject to data availability and comparability.
Food Environment Index County: Kings
Food Environment Index County: Kings
7.6
(2024)
Compared to:

CA Counties
The distribution is based on data from 58 California counties.
U.S. Counties
The distribution is based on data from 3,108 U.S. counties and county equivalents.
CA Value
(8.6)
The regional value is compared to the California state value.
US Value
(7.7)
The regional value is compared to the national value.
Prior Value
(7.6)
Prior Value compares a measured value with the previously measured value. Confidence intervals were not taken into account in determining the direction of the comparison.
Trend
This comparison measures the indicator’s values over multiple time periods.<br>The Mann-Kendall Test for Statistical Significance is used to evaluate the trend<br>over 4 to 10 periods of measure, subject to data availability and comparability.
Number of Summer Meals Served County: Kings
Number of Summer Meals Served County: Kings
62,339
Meals
(2019)
Compared to:
Prior Value
(59,851)
Prior Value compares a measured value with the previously measured value. Confidence intervals were not taken into account in determining the direction of the comparison.
Trend
This comparison measures the indicator’s values over multiple time periods.<br>The Mann-Kendall Test for Statistical Significance is used to evaluate the trend<br>over 4 to 10 periods of measure, subject to data availability and comparability.
Number of Summer Meals Sites County: Kings
Number of Summer Meals Sites County: Kings
28
Sites
(2019)
Compared to:
Prior Value
(27)
Prior Value compares a measured value with the previously measured value. Confidence intervals were not taken into account in determining the direction of the comparison.
Trend
This comparison measures the indicator’s values over multiple time periods.<br>The Mann-Kendall Test for Statistical Significance is used to evaluate the trend<br>over 4 to 10 periods of measure, subject to data availability and comparability.
Health / Nutrition & Healthy Eating
Respondents who are not familiar with healthy food available in the community
Value
Compared to:
Respondents who are not familiar with healthy food available in the community County: Kings
Respondents who are not familiar with healthy food available in the community County: Kings
14.2%
(2023)
Compared to:


Prior Value
(7.1%)
Prior Value compares a measured value with the previously measured value. Confidence intervals were not taken into account in determining the direction of the comparison.
Trend
This comparison measures the indicator’s values over multiple time periods.<br>The Mann-Kendall Test for Statistical Significance is used to evaluate the trend<br>over 4 to 10 periods of measure, subject to data availability and comparability.
Health / Nutrition & Healthy Eating
Respondents who don't feel full when eating healthy food
Value
Compared to:
Respondents who don't feel full when eating healthy food County: Kings
Respondents who don't feel full when eating healthy food County: Kings
8.4%
(2023)
Compared to:
Prior Value
(9.5%)
Prior Value compares a measured value with the previously measured value. Confidence intervals were not taken into account in determining the direction of the comparison.
Trend
This comparison measures the indicator’s values over multiple time periods.<br>The Mann-Kendall Test for Statistical Significance is used to evaluate the trend<br>over 4 to 10 periods of measure, subject to data availability and comparability.
Health / Nutrition & Healthy Eating
Respondents who don't have anywhere to prepare healthy food
Value
Compared to:
Respondents who don't have anywhere to prepare healthy food County: Kings
Respondents who don't have anywhere to prepare healthy food County: Kings
14.2%
(2023)
Compared to:

Prior Value
(2.4%)
Prior Value compares a measured value with the previously measured value. Confidence intervals were not taken into account in determining the direction of the comparison.
Trend
This comparison measures the indicator’s values over multiple time periods.<br>The Mann-Kendall Test for Statistical Significance is used to evaluate the trend<br>over 4 to 10 periods of measure, subject to data availability and comparability.
Health / Nutrition & Healthy Eating
Respondents who don't have time to cook healthy food
Value
Compared to:
Respondents who don't have time to cook healthy food County: Kings
Respondents who don't have time to cook healthy food County: Kings
24.9%
(2023)
Compared to:
Prior Value
(20.3%)
Prior Value compares a measured value with the previously measured value. Confidence intervals were not taken into account in determining the direction of the comparison.
Trend
This comparison measures the indicator’s values over multiple time periods.<br>The Mann-Kendall Test for Statistical Significance is used to evaluate the trend<br>over 4 to 10 periods of measure, subject to data availability and comparability.
Health / Nutrition & Healthy Eating
Respondents who don't have transportation to access healthy food
Value
Compared to:
Respondents who don't have transportation to access healthy food County: Kings
Respondents who don't have transportation to access healthy food County: Kings
11.5%
(2023)
Compared to:
Prior Value
(1.2%)
Prior Value compares a measured value with the previously measured value. Confidence intervals were not taken into account in determining the direction of the comparison.
Trend
This comparison measures the indicator’s values over multiple time periods.<br>The Mann-Kendall Test for Statistical Significance is used to evaluate the trend<br>over 4 to 10 periods of measure, subject to data availability and comparability.
Health / Nutrition & Healthy Eating
Respondents who don't know how to cook healthy food
Value
Compared to:
Respondents who don't know how to cook healthy food County: Kings
Respondents who don't know how to cook healthy food County: Kings
16.6%
(2023)
Compared to:
Prior Value
(13.6%)
Prior Value compares a measured value with the previously measured value. Confidence intervals were not taken into account in determining the direction of the comparison.
Trend
This comparison measures the indicator’s values over multiple time periods.<br>The Mann-Kendall Test for Statistical Significance is used to evaluate the trend<br>over 4 to 10 periods of measure, subject to data availability and comparability.
Health / Nutrition & Healthy Eating
Respondents who don't know how to select healthy food when in the store
Value
Compared to:
Respondents who don't know how to select healthy food when in the store County: Kings
Respondents who don't know how to select healthy food when in the store County: Kings
18.6%
(2023)
Compared to:
Prior Value
(10.8%)
Prior Value compares a measured value with the previously measured value. Confidence intervals were not taken into account in determining the direction of the comparison.
Trend
This comparison measures the indicator’s values over multiple time periods.<br>The Mann-Kendall Test for Statistical Significance is used to evaluate the trend<br>over 4 to 10 periods of measure, subject to data availability and comparability.
Health / Nutrition & Healthy Eating
Respondents who don't like the taste of healthy food
Value
Compared to:
Respondents who don't like the taste of healthy food County: Kings
Respondents who don't like the taste of healthy food County: Kings
12.7%
(2023)
Compared to:
Prior Value
(5.7%)
Prior Value compares a measured value with the previously measured value. Confidence intervals were not taken into account in determining the direction of the comparison.
Trend
This comparison measures the indicator’s values over multiple time periods.<br>The Mann-Kendall Test for Statistical Significance is used to evaluate the trend<br>over 4 to 10 periods of measure, subject to data availability and comparability.
Health / Nutrition & Healthy Eating
Respondents who feel healthy food goes bad before they can finish it
Value
Compared to:
Respondents who feel healthy food goes bad before they can finish it County: Kings
Respondents who feel healthy food goes bad before they can finish it County: Kings
30.0%
(2023)
Compared to:
Prior Value
(24.8%)
Prior Value compares a measured value with the previously measured value. Confidence intervals were not taken into account in determining the direction of the comparison.
Trend
This comparison measures the indicator’s values over multiple time periods.<br>The Mann-Kendall Test for Statistical Significance is used to evaluate the trend<br>over 4 to 10 periods of measure, subject to data availability and comparability.
Health / Nutrition & Healthy Eating
Respondents who feel healthy food is too expensive
Value
Compared to:
Respondents who feel healthy food is too expensive County: Kings
Respondents who feel healthy food is too expensive County: Kings
45.7%
(2023)
Compared to:
Prior Value
(44.7%)
Prior Value compares a measured value with the previously measured value. Confidence intervals were not taken into account in determining the direction of the comparison.
Trend
This comparison measures the indicator’s values over multiple time periods.<br>The Mann-Kendall Test for Statistical Significance is used to evaluate the trend<br>over 4 to 10 periods of measure, subject to data availability and comparability.
Health / Nutrition & Healthy Eating
Respondents who feel there are no places to buy healthy food near their home
Value
Compared to:
Respondents who feel there are no places to buy healthy food near their home County: Kings
Respondents who feel there are no places to buy healthy food near their home County: Kings
12.6%
(2023)
Compared to:
Prior Value
(13.0%)
Prior Value compares a measured value with the previously measured value. Confidence intervals were not taken into account in determining the direction of the comparison.
Trend
This comparison measures the indicator’s values over multiple time periods.<br>The Mann-Kendall Test for Statistical Significance is used to evaluate the trend<br>over 4 to 10 periods of measure, subject to data availability and comparability.
Health / Nutrition & Healthy Eating
Respondents who need assistance with nutrition education
Value
Compared to:
Respondents who need assistance with nutrition education County: Kings
Respondents who need assistance with nutrition education County: Kings
12.5%
(2023)
Compared to:
Prior Value
(10.6%)
Prior Value compares a measured value with the previously measured value. Confidence intervals were not taken into account in determining the direction of the comparison.
Health / Nutrition & Healthy Eating
Respondents who Stated They Eat Healthy Food Most of the Time
Value
Compared to:
Respondents who Stated They Eat Healthy Food Most of the Time County: Kings
Respondents who Stated They Eat Healthy Food Most of the Time County: Kings
20.2%
(2023)
Compared to:


Prior Value
(41.9%)
Prior Value compares a measured value with the previously measured value. Confidence intervals were not taken into account in determining the direction of the comparison.
Trend
This comparison measures the indicator’s values over multiple time periods.<br>The Mann-Kendall Test for Statistical Significance is used to evaluate the trend<br>over 4 to 10 periods of measure, subject to data availability and comparability.
Kings County 2023 Target
(72.9%)
Health / Nutrition & Healthy Eating
Respondents whose family doesn't like healthy food
Value
Compared to:
Respondents whose family doesn't like healthy food County: Kings
Respondents whose family doesn't like healthy food County: Kings
9.2%
(2023)
Compared to:
Prior Value
(10.2%)
Prior Value compares a measured value with the previously measured value. Confidence intervals were not taken into account in determining the direction of the comparison.
Trend
This comparison measures the indicator’s values over multiple time periods.<br>The Mann-Kendall Test for Statistical Significance is used to evaluate the trend<br>over 4 to 10 periods of measure, subject to data availability and comparability.
Health / Weight Status
5th Grade Students who are Overweight or Obese County: Kings
5th Grade Students who are Overweight or Obese County: Kings
47.2%
(2018-2019)
Compared to:
CA Counties
The distribution is based on data from 58 California counties.
CA Value
(41.3%)
The regional value is compared to the California state value.
Prior Value
(45.5%)
Prior Value compares a measured value with the previously measured value. Confidence intervals were not taken into account in determining the direction of the comparison.
Trend
This comparison measures the indicator’s values over multiple time periods.<br>The Mann-Kendall Test for Statistical Significance is used to evaluate the trend<br>over 4 to 10 periods of measure, subject to data availability and comparability.
9th Grade Students who are Overweight or Obese County: Kings
9th Grade Students who are Overweight or Obese County: Kings
42.4%
(2018-2019)
Compared to:

CA Counties
The distribution is based on data from 58 California counties.
CA Value
(37.8%)
The regional value is compared to the California state value.
Prior Value
(43.1%)
Prior Value compares a measured value with the previously measured value. Confidence intervals were not taken into account in determining the direction of the comparison.
Trend
This comparison measures the indicator’s values over multiple time periods.<br>The Mann-Kendall Test for Statistical Significance is used to evaluate the trend<br>over 4 to 10 periods of measure, subject to data availability and comparability.
Adults Happy with Weight County: Kings
Adults Happy with Weight County: Kings
44.6%
(2023)
Compared to:
CA Counties
The distribution is based on data from 58 California counties.
CA Value
(50.4%)
The regional value is compared to the California state value.
US Value
(48.7%)
The regional value is compared to the national value.
Prior Value
(47.7%)
Prior Value compares a measured value with the previously measured value. Confidence intervals were not taken into account in determining the direction of the comparison.
Adults Who Are Obese County: Kings
Adults Who Are Obese County: Kings
32.1%
(2022)
Compared to:
CA Counties
The distribution is based on data from 58 California counties.
CA Value
(28.8%)
The regional value is compared to the California state value.
US Value
(33.6%)
The regional value is compared to the national value. The source for the national value is Behavioral Risk Factor Surveillance System
Prior Value
(50.5%)
Prior Value compares a measured value with the previously measured value. Confidence intervals were taken into account in determining the direction of the comparison.
Trend
This comparison measures the indicator’s values over multiple time periods.<br>The Mann-Kendall Test for Statistical Significance is used to evaluate the trend<br>over 4 to 10 periods of measure, subject to data availability and comparability.
Adults who are Overweight or Obese County: Kings
Adults who are Overweight or Obese County: Kings
72.5%
(2022)
Compared to:
CA Counties
The distribution is based on data from 58 California counties.
CA Value
(62.3%)
The regional value is compared to the California state value.
US Value
(67.7%)
The regional value is compared to the national value. The source for the national value is Behavioral Risk Factor Surveillance System
Prior Value
(78.2%)
Prior Value compares a measured value with the previously measured value. Confidence intervals were taken into account in determining the direction of the comparison.
Trend
This comparison measures the indicator’s values over multiple time periods.<br>The Mann-Kendall Test for Statistical Significance is used to evaluate the trend<br>over 4 to 10 periods of measure, subject to data availability and comparability.
Children who are Overweight for Age County: Kings
Children who are Overweight for Age County: Kings
17.8%
(2021-2022)
Compared to:
CA Value
(16.6%)
The regional value is compared to the California state value.
Prior Value
(15.7%)
Prior Value compares a measured value with the previously measured value. Confidence intervals were taken into account in determining the direction of the comparison.
Trend
This comparison measures the indicator’s values over multiple time periods.<br>The Mann-Kendall Test for Statistical Significance is used to evaluate the trend<br>over 4 to 10 periods of measure, subject to data availability and comparability.
Health / Wellness & Lifestyle
Health / Wellness & Lifestyle
Adult Self-Reported General Health Assessment: Good or Better
Value
Compared to:
Adult Self-Reported General Health Assessment: Good or Better County: Kings
Adult Self-Reported General Health Assessment: Good or Better County: Kings
80.7%
(2021-2022)
Compared to:
CA Counties
The distribution is based on data from 58 California counties.
CA Value
(85.0%)
The regional value is compared to the California state value.
Prior Value
(81.7%)
Prior Value compares a measured value with the previously measured value. Confidence intervals were taken into account in determining the direction of the comparison.
Trend
This comparison measures the indicator’s values over multiple time periods.<br>The Mann-Kendall Test for Statistical Significance is used to evaluate the trend<br>over 4 to 10 periods of measure, subject to data availability and comparability.
Health / Wellness & Lifestyle
Adults who Agree Vaccine Benefits Outweigh Possible Risks
Value
Compared to:
Adults who Agree Vaccine Benefits Outweigh Possible Risks County: Kings
Adults who Agree Vaccine Benefits Outweigh Possible Risks County: Kings
63.4%
(2023)
Compared to:
CA Counties
The distribution is based on data from 58 California counties.
U.S. Counties
The distribution is based on data from 3,141 U.S. counties and county equivalents.
CA Value
(73.0%)
The regional value is compared to the California state value.
US Value
(70.1%)
The regional value is compared to the national value.
Prior Value
(68.4%)
Prior Value compares a measured value with the previously measured value. Confidence intervals were not taken into account in determining the direction of the comparison.
Adults Who Belong to a Fitness Club or Gym County: Kings
Adults Who Belong to a Fitness Club or Gym County: Kings
14.1%
(2023)
Compared to:


CA Value
(18.7%)
The regional value is compared to the California state value.
US Value
(16.0%)
The regional value is compared to the national value.
Prior Value
(15.2%)
Prior Value compares a measured value with the previously measured value. Confidence intervals were not taken into account in determining the direction of the comparison.
Adults who Feel Life is Slipping Out of Control County: Kings
Adults who Feel Life is Slipping Out of Control County: Kings
27.9%
(2023)
Compared to:
CA Counties
The distribution is based on data from 58 California counties.
CA Value
(26.6%)
The regional value is compared to the California state value.
US Value
(26.7%)
The regional value is compared to the national value.
Prior Value
(30.7%)
Prior Value compares a measured value with the previously measured value. Confidence intervals were not taken into account in determining the direction of the comparison.
Adults who Follow a Regular Exercise Routine County: Kings
Adults who Follow a Regular Exercise Routine County: Kings
61.2%
(2023)
Compared to:
CA Counties
The distribution is based on data from 58 California counties.
CA Value
(69.3%)
The regional value is compared to the California state value.
US Value
(67.2%)
The regional value is compared to the national value.
Prior Value
(49.4%)
Prior Value compares a measured value with the previously measured value. Confidence intervals were not taken into account in determining the direction of the comparison.
Adults with Medical Conditions Limiting Lifestyle County: Kings
Adults with Medical Conditions Limiting Lifestyle County: Kings
31.9%
(2023)
Compared to:
CA Value
(31.9%)
The regional value is compared to the California state value.
US Value
(33.6%)
The regional value is compared to the national value.
Prior Value
(33.8%)
Prior Value compares a measured value with the previously measured value. Confidence intervals were not taken into account in determining the direction of the comparison.
Health / Wellness & Lifestyle
Child and Teen Self-Reported General Health Assessment: Good or Better
Value
Compared to:
Child and Teen Self-Reported General Health Assessment: Good or Better County: Kings
Child and Teen Self-Reported General Health Assessment: Good or Better County: Kings
94.7%
(2021-2022)
Compared to:
CA Value
(95.2%)
The regional value is compared to the California state value.
Prior Value
(96.7%)
Prior Value compares a measured value with the previously measured value. Confidence intervals were taken into account in determining the direction of the comparison.
Frequent Physical Distress County: Kings
Frequent Physical Distress County: Kings
14.7%
(2019)
Compared to:
CA Counties
The distribution is based on data from 58 California counties.
U.S. Counties
The distribution is based on data from 3,121 U.S. counties and county equivalents.
CA Value
(11.3%)
The regional value is compared to the California state value.
US Value
(12.0%)
The regional value is compared to the national value.
Prior Value
(15.6%)
Prior Value compares a measured value with the previously measured value. Confidence intervals were taken into account in determining the direction of the comparison.
High Blood Pressure Prevalence County: Kings
High Blood Pressure Prevalence County: Kings
34.8%
(2022)
Compared to:
CA Counties
The distribution is based on data from 58 California counties.
CA Value
(34.8%)
The regional value is compared to the California state value.
US Value
(32.4% in 2021)
The regional value is compared to the national value. The source for the national value is Behavioral Risk Factor Surveillance System
Prior Value
(22.5%)
Prior Value compares a measured value with the previously measured value. Confidence intervals were taken into account in determining the direction of the comparison.
Trend
This comparison measures the indicator’s values over multiple time periods.<br>The Mann-Kendall Test for Statistical Significance is used to evaluate the trend<br>over 4 to 10 periods of measure, subject to data availability and comparability.
HP 2030 Target
(41.9%)
Life Expectancy County: Kings
Life Expectancy County: Kings
77.3
Years
(2019-2021)
Compared to:

CA Counties
The distribution is based on data from 57 California counties.
U.S. Counties
The distribution is based on data from 3,070 U.S. counties and county equivalents.
CA Value
(79.9)
The regional value is compared to the California state value.
US Value
(77.6)
The regional value is compared to the national value.
Poor Physical Health: 14+ Days County: Kings
Poor Physical Health: 14+ Days County: Kings
16.0%
(2022)
Compared to:
CA Counties
The distribution is based on data from 58 California counties.
U.S. Counties
The distribution is based on data from 3,133 U.S. counties and county equivalents.
US Value
(12.7%)
The regional value is compared to the national value.
Poor Physical Health: Average Number of Days County: Kings
Poor Physical Health: Average Number of Days County: Kings
4.3
Days
(2021)
Compared to:
CA Counties
The distribution is based on data from 58 California counties.
U.S. Counties
The distribution is based on data from 3,141 U.S. counties and county equivalents.
CA Value
(3.1)
The regional value is compared to the California state value.
US Value
(3.3)
The regional value is compared to the national value.
Prior Value
(3.9)
Prior Value compares a measured value with the previously measured value. Confidence intervals were taken into account in determining the direction of the comparison.
Trend
This comparison measures the indicator’s values over multiple time periods.<br>The Mann-Kendall Test for Statistical Significance is used to evaluate the trend<br>over 4 to 10 periods of measure, subject to data availability and comparability.
Health / Wellness & Lifestyle
Self-Reported General Health Assessment: Good or Better
Value
Compared to:
Self-Reported General Health Assessment: Good or Better County: Kings
Self-Reported General Health Assessment: Good or Better County: Kings
83.8%
(2022)
Compared to:
CA Counties
The distribution is based on data from 58 California counties.
CA Value
(86.0%)
The regional value is compared to the California state value.
Prior Value
(82.9%)
Prior Value compares a measured value with the previously measured value. Confidence intervals were taken into account in determining the direction of the comparison.
Trend
This comparison measures the indicator’s values over multiple time periods.<br>The Mann-Kendall Test for Statistical Significance is used to evaluate the trend<br>over 4 to 10 periods of measure, subject to data availability and comparability.
Health / Wellness & Lifestyle
Self-Reported General Health Assessment: Poor or Fair
Value
Compared to:
Self-Reported General Health Assessment: Poor or Fair County: Kings
Self-Reported General Health Assessment: Poor or Fair County: Kings
25.5%
(2022)
Compared to:
CA Counties
The distribution is based on data from 58 California counties.
U.S. Counties
The distribution is based on data from 3,133 U.S. counties and county equivalents.
US Value
(17.9%)
The regional value is compared to the national value.
