
Search for Indicators
Tobacco Free Living
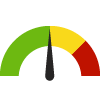
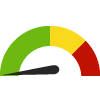
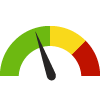
Indicator Gauge Icon Legend
Legend Colors
Red is bad, green is good, blue is not statistically different/neutral.
Compared to Distribution
 the value is in the best half of communities.
 the value is in the 2nd worst quarter of communities.
 the value is in the worst quarter of communities.
Compared to Target
 meets target;
  does not meet target.
Compared to a Single Value
 lower than the comparison value;
 higher than the comparison value;
 not statistically different from comparison value.
Trend

 non-significant change over time;
 significant change over time;
  no change over time.
Compared to Prior Value
 higher than the previous measurement period;
 lower than the previous measurement period;
 no statistically different change from previous measurement period.
Health / Tobacco Use
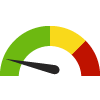
Adults Who Bought Medications to Quit Smoking County: Kings
Adults Who Bought Medications to Quit Smoking County: Kings
1.5%
(2023)
Compared to:


CA Value
(1.2%)
The regional value is compared to the California state value.
US Value
(1.4%)
The regional value is compared to the national value.
Prior Value
(1.6%)
Prior Value compares a measured value with the previously measured value. Confidence intervals were not taken into account in determining the direction of the comparison.
Trend
This comparison measures the indicator’s values over multiple time periods.<br>The Mann-Kendall Test for Statistical Significance is used to evaluate the trend<br>over 4 to 10 periods of measure, subject to data availability and comparability.
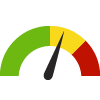
Adults who Smoke County: Kings
Adults who Smoke County: Kings
12.7%
(2021-2022)
Compared to:

CA Counties
The distribution is based on data from 58 California counties.
CA Value
(6.1%)
The regional value is compared to the California state value.
US Value
(14.0% in 2022)
The regional value is compared to the national value. The source for the national value is Behavioral Risk Factor Surveillance System
Prior Value
(12.7%)
Prior Value compares a measured value with the previously measured value. Confidence intervals were taken into account in determining the direction of the comparison.
Trend
This comparison measures the indicator’s values over multiple time periods.<br>The Mann-Kendall Test for Statistical Significance is used to evaluate the trend<br>over 4 to 10 periods of measure, subject to data availability and comparability.
HP 2030 Target
(6.1%)
<div>TU-02: Reduce current cigarette smoking in adults <strong>(LEADING HEALTH INDICATOR)</strong></div>
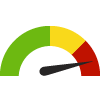
Adults Who Used Electronic Cigarettes: Past 30 Days County: Kings
Adults Who Used Electronic Cigarettes: Past 30 Days County: Kings
7.0%
(2023)
Compared to:
CA Counties
The distribution is based on data from 58 California counties.
U.S. Counties
The distribution is based on data from 3,141 U.S. counties and county equivalents.
CA Value
(5.5%)
The regional value is compared to the California state value.
US Value
(5.9%)
The regional value is compared to the national value.
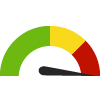
Adults Who Used Smokeless Tobacco: Past 30 Days County: Kings
Adults Who Used Smokeless Tobacco: Past 30 Days County: Kings
1.7%
(2023)
Compared to:
CA Counties
The distribution is based on data from 58 California counties.
U.S. Counties
The distribution is based on data from 3,141 U.S. counties and county equivalents.
CA Value
(1.0%)
The regional value is compared to the California state value.
US Value
(1.7%)
The regional value is compared to the national value.
Prior Value
(1.8%)
Prior Value compares a measured value with the previously measured value. Confidence intervals were not taken into account in determining the direction of the comparison.
Trend
This comparison measures the indicator’s values over multiple time periods.<br>The Mann-Kendall Test for Statistical Significance is used to evaluate the trend<br>over 4 to 10 periods of measure, subject to data availability and comparability.
Lung and Bronchus Cancer Incidence Rate County: Kings
Lung and Bronchus Cancer Incidence Rate County: Kings
36.6
Cases per 100,000 population
(2017-2021)
Compared to:
CA Counties
The distribution is based on data from 55 California counties.
U.S. Counties
The distribution is based on data from 2,711 U.S. counties and county equivalents.
CA Value
(36.7)
The regional value is compared to the California state value.
US Value
(53.1)
The regional value is compared to the national value.
Prior Value
(37.1)
Prior Value compares a measured value with the previously measured value. Confidence intervals were taken into account in determining the direction of the comparison.
Trend
This comparison measures the indicator’s values over multiple time periods.<br>The Mann-Kendall Test for Statistical Significance is used to evaluate the trend<br>over 4 to 10 periods of measure, subject to data availability and comparability.
Teens who Smoke: 11th Graders County: Kings
Teens who Smoke: 11th Graders County: Kings
3.0%
(2017-2019)
Compared to:
CA Value
(2.0%)
The regional value is compared to the California state value.
Prior Value
(8.0%)
Prior Value compares a measured value with the previously measured value. Confidence intervals were not taken into account in determining the direction of the comparison.
Teens who Smoke: 7th Graders County: Kings
Teens who Smoke: 7th Graders County: Kings
0.0%
(2017-2019)
Compared to:
CA Value
(1.0%)
The regional value is compared to the California state value.
Prior Value
(1.0%)
Prior Value compares a measured value with the previously measured value. Confidence intervals were not taken into account in determining the direction of the comparison.
Teens who Smoke: 9th Graders County: Kings
Teens who Smoke: 9th Graders County: Kings
2.0%
(2017-2019)
Compared to:
CA Value
(2.0%)
The regional value is compared to the California state value.
Prior Value
(4.0%)
Prior Value compares a measured value with the previously measured value. Confidence intervals were not taken into account in determining the direction of the comparison.
