
Search for Indicators
Got Needs? Kings County Community Survey

The Got Needs Survey serves as a county-wide, perception-based assessment and is a valuable community instrument for amplifying the voices of Kings County residents, with a particular focus on those who are most vulnerable.
.
Orchestrated by the Kings Community Action Organization (KCAO) and undertaken in partnership with Kings Partnership, the Got Needs survey plays a significant role in assisting KCAO to identify community priorities over the upcoming two-year period. This involves the expansion of existing programs, pursuit of funding for initiatives, and reinforcement of deficiencies within Kings County communities.
.
Got Needs offers individuals the platform to express their own perspectives and yields invaluable insights that steer the course of community initiatives toward effective solutions. Your participation in this year's Got Needs survey is essential to ensuring that the needs of our communities are recognized and addressed!

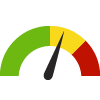
Indicator Gauge Icon Legend
Legend Colors
Red is bad, green is good, blue is not statistically different/neutral.
Compared to Distribution
 the value is in the best half of communities.
 the value is in the 2nd worst quarter of communities.
 the value is in the worst quarter of communities.
Compared to Target
 meets target;
  does not meet target.
Compared to a Single Value
 lower than the comparison value;
 higher than the comparison value;
 not statistically different from comparison value.
Trend

 non-significant change over time;
 significant change over time;
  no change over time.
Compared to Prior Value
 higher than the previous measurement period;
 lower than the previous measurement period;
 no statistically different change from previous measurement period.
Health / Alcohol & Drug Use
Health / Alcohol & Drug Use
Respondents who Have Used Drug and Alcohol Services in the Community
Value
Compared to:
Respondents who Have Used Drug and Alcohol Services in the Community County: Kings
Respondents who Have Used Drug and Alcohol Services in the Community County: Kings
12.3%
(2023)
Compared to:


Prior Value
(3.4%)
Prior Value compares a measured value with the previously measured value. Confidence intervals were not taken into account in determining the direction of the comparison.
Trend
This comparison measures the indicator’s values over multiple time periods.<br>The Mann-Kendall Test for Statistical Significance is used to evaluate the trend<br>over 4 to 10 periods of measure, subject to data availability and comparability.
Health / Family Planning
Health / Family Planning
Respondents who are Aware of Free to Low-Cost Family Planning Services in the Community
Value
Compared to:
Respondents who are Aware of Free to Low-Cost Family Planning Services in the Community County: Kings
Respondents who are Aware of Free to Low-Cost Family Planning Services in the Community County: Kings
58.2%
(2023)
Compared to:
Prior Value
(44.2%)
Prior Value compares a measured value with the previously measured value. Confidence intervals were not taken into account in determining the direction of the comparison.
Kings County 2023 Target
(55.2%)
Health / Health Care Access & Quality
Health / Health Care Access & Quality
Respondents Who Are Able to Access Medical Services
Value
Compared to:
Respondents Who Are Able to Access Medical Services County: Kings
Respondents Who Are Able to Access Medical Services County: Kings
92.2%
(2023)
Compared to:

Prior Value
(94.0%)
Prior Value compares a measured value with the previously measured value. Confidence intervals were not taken into account in determining the direction of the comparison.
Trend
This comparison measures the indicator’s values over multiple time periods.<br>The Mann-Kendall Test for Statistical Significance is used to evaluate the trend<br>over 4 to 10 periods of measure, subject to data availability and comparability.
Kings County 2023 Target
(96.0%)
Health / Health Care Access & Quality
Respondents who are Able to Access Telehealth Services
Value
Compared to:
Respondents who are Able to Access Telehealth Services County: Kings
Respondents who are Able to Access Telehealth Services County: Kings
79.9%
(2023)
Compared to:
Prior Value
(31.7%)
Prior Value compares a measured value with the previously measured value. Confidence intervals were not taken into account in determining the direction of the comparison.
Health / Health Care Access & Quality
Respondents who are unable to access medical services due to a lack of childcare
Value
Compared to:
Respondents who are unable to access medical services due to a lack of childcare County: Kings
Respondents who are unable to access medical services due to a lack of childcare County: Kings
4.3%
(2023)
Compared to:
Prior Value
(8.5%)
Prior Value compares a measured value with the previously measured value. Confidence intervals were not taken into account in determining the direction of the comparison.
Trend
This comparison measures the indicator’s values over multiple time periods.<br>The Mann-Kendall Test for Statistical Significance is used to evaluate the trend<br>over 4 to 10 periods of measure, subject to data availability and comparability.
Health / Health Care Access & Quality
Respondents who are unable to access medical services due to a lack of local specialists
Value
Compared to:
Respondents who are unable to access medical services due to a lack of local specialists County: Kings
Respondents who are unable to access medical services due to a lack of local specialists County: Kings
36.7%
(2023)
Compared to:

Prior Value
(14.9%)
Prior Value compares a measured value with the previously measured value. Confidence intervals were not taken into account in determining the direction of the comparison.
Health / Health Care Access & Quality
Respondents who are unable to access medical services due to finances
Value
Compared to:
Respondents who are unable to access medical services due to finances County: Kings
Respondents who are unable to access medical services due to finances County: Kings
17.6%
(2023)
Compared to:
Prior Value
(17.0%)
Prior Value compares a measured value with the previously measured value. Confidence intervals were not taken into account in determining the direction of the comparison.
Trend
This comparison measures the indicator’s values over multiple time periods.<br>The Mann-Kendall Test for Statistical Significance is used to evaluate the trend<br>over 4 to 10 periods of measure, subject to data availability and comparability.
Health / Health Care Access & Quality
Respondents who are unable to access medical services due to having no insurance
Value
Compared to:
Respondents who are unable to access medical services due to having no insurance County: Kings
Respondents who are unable to access medical services due to having no insurance County: Kings
22.9%
(2023)
Compared to:
Prior Value
(48.9%)
Prior Value compares a measured value with the previously measured value. Confidence intervals were not taken into account in determining the direction of the comparison.
Health / Health Care Access & Quality
Respondents who are unable to access medical services due to healthcare hours
Value
Compared to:
Respondents who are unable to access medical services due to healthcare hours County: Kings
Respondents who are unable to access medical services due to healthcare hours County: Kings
46.3%
(2023)
Compared to:
Prior Value
(10.6%)
Prior Value compares a measured value with the previously measured value. Confidence intervals were not taken into account in determining the direction of the comparison.
Trend
This comparison measures the indicator’s values over multiple time periods.<br>The Mann-Kendall Test for Statistical Significance is used to evaluate the trend<br>over 4 to 10 periods of measure, subject to data availability and comparability.
Health / Health Care Access & Quality
Respondents who are unable to access medical services due to lack of transportation
Value
Compared to:
Respondents who are unable to access medical services due to lack of transportation County: Kings
Respondents who are unable to access medical services due to lack of transportation County: Kings
37.2%
(2023)
Compared to:
Prior Value
(6.4%)
Prior Value compares a measured value with the previously measured value. Confidence intervals were not taken into account in determining the direction of the comparison.
Trend
This comparison measures the indicator’s values over multiple time periods.<br>The Mann-Kendall Test for Statistical Significance is used to evaluate the trend<br>over 4 to 10 periods of measure, subject to data availability and comparability.
Health / Health Care Access & Quality
Respondents who are unable to access medical services due to scheduling conflicts
Value
Compared to:
Respondents who are unable to access medical services due to scheduling conflicts County: Kings
Respondents who are unable to access medical services due to scheduling conflicts County: Kings
30.9%
(2023)
Compared to:

Prior Value
(19.2%)
Prior Value compares a measured value with the previously measured value. Confidence intervals were not taken into account in determining the direction of the comparison.
Trend
This comparison measures the indicator’s values over multiple time periods.<br>The Mann-Kendall Test for Statistical Significance is used to evaluate the trend<br>over 4 to 10 periods of measure, subject to data availability and comparability.
Health / Health Care Access & Quality
Respondents who are unable to access mental health services due to a lack of childcare
Value
Compared to:
Respondents who are unable to access mental health services due to a lack of childcare County: Kings
Respondents who are unable to access mental health services due to a lack of childcare County: Kings
20.4%
(2023)
Compared to:
Prior Value
(6.8%)
Prior Value compares a measured value with the previously measured value. Confidence intervals were not taken into account in determining the direction of the comparison.
Health / Health Care Access & Quality
Respondents who are unable to access telehealth services due to finances
Value
Compared to:
Respondents who are unable to access telehealth services due to finances County: Kings
Respondents who are unable to access telehealth services due to finances County: Kings
17.2%
(2023)
Compared to:
Prior Value
(8.2%)
Prior Value compares a measured value with the previously measured value. Confidence intervals were not taken into account in determining the direction of the comparison.
Health / Health Care Access & Quality
Respondents who are unable to access telehealth services due to having no cell phone
Value
Compared to:
Respondents who are unable to access telehealth services due to having no cell phone County: Kings
Respondents who are unable to access telehealth services due to having no cell phone County: Kings
28.3%
(2023)
Compared to:
Prior Value
(8.2%)
Prior Value compares a measured value with the previously measured value. Confidence intervals were not taken into account in determining the direction of the comparison.
Health / Health Care Access & Quality
Respondents who are unable to access telehealth services due to having no computer
Value
Compared to:
Respondents who are unable to access telehealth services due to having no computer County: Kings
Respondents who are unable to access telehealth services due to having no computer County: Kings
17.8%
(2023)
Compared to:
Prior Value
(28.6%)
Prior Value compares a measured value with the previously measured value. Confidence intervals were not taken into account in determining the direction of the comparison.
Health / Health Care Access & Quality
Respondents who are unable to access telehealth services due to having no internet service
Value
Compared to:
Respondents who are unable to access telehealth services due to having no internet service County: Kings
Respondents who are unable to access telehealth services due to having no internet service County: Kings
21.1%
(2023)
Compared to:
Prior Value
(10.2%)
Prior Value compares a measured value with the previously measured value. Confidence intervals were not taken into account in determining the direction of the comparison.
Health / Health Care Access & Quality
Respondents who are unable to access telehealth services due to lack of privacy
Value
Compared to:
Respondents who are unable to access telehealth services due to lack of privacy County: Kings
Respondents who are unable to access telehealth services due to lack of privacy County: Kings
20.6%
(2023)
Compared to:
Prior Value
(18.4%)
Prior Value compares a measured value with the previously measured value. Confidence intervals were not taken into account in determining the direction of the comparison.
Health / Health Care Access & Quality
Respondents who are unable to access telehealth services due to not feeling secure
Value
Compared to:
Respondents who are unable to access telehealth services due to not feeling secure County: Kings
Respondents who are unable to access telehealth services due to not feeling secure County: Kings
9.4%
(2023)
Compared to:
Prior Value
(12.2%)
Prior Value compares a measured value with the previously measured value. Confidence intervals were not taken into account in determining the direction of the comparison.
Health / Health Care Access & Quality
Respondents who are unable to access telehealth services due to provider hours
Value
Compared to:
Respondents who are unable to access telehealth services due to provider hours County: Kings
Respondents who are unable to access telehealth services due to provider hours County: Kings
42.2%
(2023)
Compared to:
Prior Value
(10.2%)
Prior Value compares a measured value with the previously measured value. Confidence intervals were not taken into account in determining the direction of the comparison.
Health / Health Care Access & Quality
Respondents who are unable to access telehealth services due to stigma
Value
Compared to:
Respondents who are unable to access telehealth services due to stigma County: Kings
Respondents who are unable to access telehealth services due to stigma County: Kings
13.9%
(2023)
Compared to:
Prior Value
(4.1%)
Prior Value compares a measured value with the previously measured value. Confidence intervals were not taken into account in determining the direction of the comparison.
Health / Health Care Access & Quality
Respondents who are unable to access telehealth services due to the service being impersonal
Value
Compared to:
Respondents who are unable to access telehealth services due to the service being impersonal County: Kings
Respondents who are unable to access telehealth services due to the service being impersonal County: Kings
22.8%
(2023)
Compared to:
Prior Value
(14.3%)
Prior Value compares a measured value with the previously measured value. Confidence intervals were not taken into account in determining the direction of the comparison.
Health / Health Care Access & Quality
Respondents who need assistance with accessing medical coverage
Value
Compared to:
Respondents who need assistance with accessing medical coverage County: Kings
Respondents who need assistance with accessing medical coverage County: Kings
14.4%
(2023)
Compared to:
Prior Value
(4.8%)
Prior Value compares a measured value with the previously measured value. Confidence intervals were not taken into account in determining the direction of the comparison.
Health / Health Care Access & Quality
Respondents Who Stated Their Families Are Covered by Health Insurance
Value
Compared to:
Respondents Who Stated Their Families Are Covered by Health Insurance County: Kings
Respondents Who Stated Their Families Are Covered by Health Insurance County: Kings
86.9%
(2023)
Compared to:
Prior Value
(91.2%)
Prior Value compares a measured value with the previously measured value. Confidence intervals were not taken into account in determining the direction of the comparison.
Trend
This comparison measures the indicator’s values over multiple time periods.<br>The Mann-Kendall Test for Statistical Significance is used to evaluate the trend<br>over 4 to 10 periods of measure, subject to data availability and comparability.
Kings County 2023 Target
(87.0%)
Health / Health Information Technology
Health / Health Information Technology
Respondents who Stated they Have Internet Access in their Home
Value
Compared to:
Respondents who Stated they Have Internet Access in their Home County: Kings
Respondents who Stated they Have Internet Access in their Home County: Kings
89.0%
(2023)
Compared to:
Prior Value
(94.2%)
Prior Value compares a measured value with the previously measured value. Confidence intervals were not taken into account in determining the direction of the comparison.
Trend
This comparison measures the indicator’s values over multiple time periods.<br>The Mann-Kendall Test for Statistical Significance is used to evaluate the trend<br>over 4 to 10 periods of measure, subject to data availability and comparability.
Kings County 2023 Target
(70.7%)
Health / Immunizations & Infectious Diseases
Health / Immunizations & Infectious Diseases
Respondents who stated COVID-19 testing services are not accessible in the community
Value
Compared to:
Respondents who stated COVID-19 testing services are not accessible in the community County: Kings
Respondents who stated COVID-19 testing services are not accessible in the community County: Kings
4.4%
(2023)
Compared to:
No Comparison Data Available
(0%)
Health / Immunizations & Infectious Diseases
Respondents who stated COVID-19 vaccine services are not accessible in the community
Value
Compared to:
Respondents who stated COVID-19 vaccine services are not accessible in the community County: Kings
Respondents who stated COVID-19 vaccine services are not accessible in the community County: Kings
3.5%
(2023)
Compared to:
No Comparison Data Available
(0%)
Health / Mental Health & Mental Disorders
Health / Mental Health & Mental Disorders
Respondents who Agreed Suicide has Seriously Affected Their Lives
Value
Compared to:
Respondents who Agreed Suicide has Seriously Affected Their Lives County: Kings
Respondents who Agreed Suicide has Seriously Affected Their Lives County: Kings
34.9%
(2023)
Compared to:
Prior Value
(11.7%)
Prior Value compares a measured value with the previously measured value. Confidence intervals were not taken into account in determining the direction of the comparison.
Kings County 2023 Target
(9.9%)
Health / Mental Health & Mental Disorders
Respondents who are Able to Access Mental Health Services
Value
Compared to:
Respondents who are Able to Access Mental Health Services County: Kings
Respondents who are Able to Access Mental Health Services County: Kings
70.9%
(2023)
Compared to:
Prior Value
(55.2%)
Prior Value compares a measured value with the previously measured value. Confidence intervals were not taken into account in determining the direction of the comparison.
Health / Mental Health & Mental Disorders
Respondents who are unable to access mental health services due to an inability to find a provider
Value
Compared to:
Respondents who are unable to access mental health services due to an inability to find a provider County: Kings
Respondents who are unable to access mental health services due to an inability to find a provider County: Kings
37.9%
(2023)
Compared to:
Prior Value
(45.8%)
Prior Value compares a measured value with the previously measured value. Confidence intervals were not taken into account in determining the direction of the comparison.
Health / Mental Health & Mental Disorders
Respondents who are unable to access mental health services due to finances
Value
Compared to:
Respondents who are unable to access mental health services due to finances County: Kings
Respondents who are unable to access mental health services due to finances County: Kings
34.5%
(2023)
Compared to:
Prior Value
(13.6%)
Prior Value compares a measured value with the previously measured value. Confidence intervals were not taken into account in determining the direction of the comparison.
Health / Mental Health & Mental Disorders
Respondents who are unable to access mental health services due to having no insurance
Value
Compared to:
Respondents who are unable to access mental health services due to having no insurance County: Kings
Respondents who are unable to access mental health services due to having no insurance County: Kings
21.8%
(2023)
Compared to:
Prior Value
(25.4%)
Prior Value compares a measured value with the previously measured value. Confidence intervals were not taken into account in determining the direction of the comparison.
Health / Mental Health & Mental Disorders
Respondents who are unable to access mental health services due to lack of transportation
Value
Compared to:
Respondents who are unable to access mental health services due to lack of transportation County: Kings
Respondents who are unable to access mental health services due to lack of transportation County: Kings
26.2%
(2023)
Compared to:
Prior Value
(3.4%)
Prior Value compares a measured value with the previously measured value. Confidence intervals were not taken into account in determining the direction of the comparison.
Health / Mental Health & Mental Disorders
Respondents who are unable to access mental health services due to not being covered by insurance
Value
Compared to:
Respondents who are unable to access mental health services due to not being covered by insurance County: Kings
Respondents who are unable to access mental health services due to not being covered by insurance County: Kings
10.7%
(2023)
Compared to:
Prior Value
(25.4%)
Prior Value compares a measured value with the previously measured value. Confidence intervals were not taken into account in determining the direction of the comparison.
Health / Mental Health & Mental Disorders
Respondents who are unable to access mental health services due to provider hours
Value
Compared to:
Respondents who are unable to access mental health services due to provider hours County: Kings
Respondents who are unable to access mental health services due to provider hours County: Kings
33.0%
(2023)
Compared to:
Prior Value
(13.6%)
Prior Value compares a measured value with the previously measured value. Confidence intervals were not taken into account in determining the direction of the comparison.
Health / Mental Health & Mental Disorders
Respondents who are unable to access mental health services due to stigma
Value
Compared to:
Respondents who are unable to access mental health services due to stigma County: Kings
Respondents who are unable to access mental health services due to stigma County: Kings
22.8%
(2023)
Compared to:
Prior Value
(13.6%)
Prior Value compares a measured value with the previously measured value. Confidence intervals were not taken into account in determining the direction of the comparison.
Health / Mental Health & Mental Disorders
Respondents Who Have Experienced an Increase in Mental Health Symptoms in Past Two Years
Value
Compared to:
Respondents Who Have Experienced an Increase in Mental Health Symptoms in Past Two Years County: Kings
Respondents Who Have Experienced an Increase in Mental Health Symptoms in Past Two Years County: Kings
60.3%
(2023)
Compared to:
Prior Value
(47.9%)
Prior Value compares a measured value with the previously measured value. Confidence intervals were not taken into account in determining the direction of the comparison.
No Comparison Data Available
(0%)
Health / Mental Health & Mental Disorders
Respondents who have experienced increased mental health symptoms but do not know where to receive mental health care
Value
Compared to:
Respondents who have experienced increased mental health symptoms but do not know where to receive mental health care County: Kings
Respondents who have experienced increased mental health symptoms but do not know where to receive mental health care County: Kings
22.9%
(2023)
Compared to:
Prior Value
(24.4%)
Prior Value compares a measured value with the previously measured value. Confidence intervals were not taken into account in determining the direction of the comparison.
Health / Mental Health & Mental Disorders
Respondents who have experienced increased mental health symptoms but have not received mental health care
Value
Compared to:
Respondents who have experienced increased mental health symptoms but have not received mental health care County: Kings
Respondents who have experienced increased mental health symptoms but have not received mental health care County: Kings
40.5%
(2023)
Compared to:
Prior Value
(61.4%)
Prior Value compares a measured value with the previously measured value. Confidence intervals were not taken into account in determining the direction of the comparison.
Health / Mental Health & Mental Disorders
Respondents who have increased mental health symptoms due to the COVID-19 pandemic
Value
Compared to:
Respondents who have increased mental health symptoms due to the COVID-19 pandemic County: Kings
Respondents who have increased mental health symptoms due to the COVID-19 pandemic County: Kings
57.2%
(2023)
Compared to:
Prior Value
(55.2%)
Prior Value compares a measured value with the previously measured value. Confidence intervals were not taken into account in determining the direction of the comparison.
Health / Mental Health & Mental Disorders
Respondents who Have Used Mental Health Services in the Community
Value
Compared to:
Respondents who Have Used Mental Health Services in the Community County: Kings
Respondents who Have Used Mental Health Services in the Community County: Kings
30.9%
(2023)
Compared to:
Prior Value
(14.1%)
Prior Value compares a measured value with the previously measured value. Confidence intervals were not taken into account in determining the direction of the comparison.
Trend
This comparison measures the indicator’s values over multiple time periods.<br>The Mann-Kendall Test for Statistical Significance is used to evaluate the trend<br>over 4 to 10 periods of measure, subject to data availability and comparability.
Health / Nutrition & Healthy Eating
Health / Nutrition & Healthy Eating
Respondents who are not familiar with healthy food available in the community
Value
Compared to:
Respondents who are not familiar with healthy food available in the community County: Kings
Respondents who are not familiar with healthy food available in the community County: Kings
14.2%
(2023)
Compared to:

Prior Value
(7.1%)
Prior Value compares a measured value with the previously measured value. Confidence intervals were not taken into account in determining the direction of the comparison.
Trend
This comparison measures the indicator’s values over multiple time periods.<br>The Mann-Kendall Test for Statistical Significance is used to evaluate the trend<br>over 4 to 10 periods of measure, subject to data availability and comparability.
Health / Nutrition & Healthy Eating
Respondents who don't feel full when eating healthy food
Value
Compared to:
Respondents who don't feel full when eating healthy food County: Kings
Respondents who don't feel full when eating healthy food County: Kings
8.4%
(2023)
Compared to:
Prior Value
(9.5%)
Prior Value compares a measured value with the previously measured value. Confidence intervals were not taken into account in determining the direction of the comparison.
Trend
This comparison measures the indicator’s values over multiple time periods.<br>The Mann-Kendall Test for Statistical Significance is used to evaluate the trend<br>over 4 to 10 periods of measure, subject to data availability and comparability.
Health / Nutrition & Healthy Eating
Respondents who don't have anywhere to prepare healthy food
Value
Compared to:
Respondents who don't have anywhere to prepare healthy food County: Kings
Respondents who don't have anywhere to prepare healthy food County: Kings
14.2%
(2023)
Compared to:
Prior Value
(2.4%)
Prior Value compares a measured value with the previously measured value. Confidence intervals were not taken into account in determining the direction of the comparison.
Trend
This comparison measures the indicator’s values over multiple time periods.<br>The Mann-Kendall Test for Statistical Significance is used to evaluate the trend<br>over 4 to 10 periods of measure, subject to data availability and comparability.
Health / Nutrition & Healthy Eating
Respondents who don't have time to cook healthy food
Value
Compared to:
Respondents who don't have time to cook healthy food County: Kings
Respondents who don't have time to cook healthy food County: Kings
24.9%
(2023)
Compared to:
Prior Value
(20.3%)
Prior Value compares a measured value with the previously measured value. Confidence intervals were not taken into account in determining the direction of the comparison.
Trend
This comparison measures the indicator’s values over multiple time periods.<br>The Mann-Kendall Test for Statistical Significance is used to evaluate the trend<br>over 4 to 10 periods of measure, subject to data availability and comparability.
Health / Nutrition & Healthy Eating
Respondents who don't have transportation to access healthy food
Value
Compared to:
Respondents who don't have transportation to access healthy food County: Kings
Respondents who don't have transportation to access healthy food County: Kings
11.5%
(2023)
Compared to:
Prior Value
(1.2%)
Prior Value compares a measured value with the previously measured value. Confidence intervals were not taken into account in determining the direction of the comparison.
Trend
This comparison measures the indicator’s values over multiple time periods.<br>The Mann-Kendall Test for Statistical Significance is used to evaluate the trend<br>over 4 to 10 periods of measure, subject to data availability and comparability.
Health / Nutrition & Healthy Eating
Respondents who don't know how to cook healthy food
Value
Compared to:
Respondents who don't know how to cook healthy food County: Kings
Respondents who don't know how to cook healthy food County: Kings
16.6%
(2023)
Compared to:
Prior Value
(13.6%)
Prior Value compares a measured value with the previously measured value. Confidence intervals were not taken into account in determining the direction of the comparison.
Trend
This comparison measures the indicator’s values over multiple time periods.<br>The Mann-Kendall Test for Statistical Significance is used to evaluate the trend<br>over 4 to 10 periods of measure, subject to data availability and comparability.
Health / Nutrition & Healthy Eating
Respondents who don't know how to select healthy food when in the store
Value
Compared to:
Respondents who don't know how to select healthy food when in the store County: Kings
Respondents who don't know how to select healthy food when in the store County: Kings
18.6%
(2023)
Compared to:
Prior Value
(10.8%)
Prior Value compares a measured value with the previously measured value. Confidence intervals were not taken into account in determining the direction of the comparison.
Trend
This comparison measures the indicator’s values over multiple time periods.<br>The Mann-Kendall Test for Statistical Significance is used to evaluate the trend<br>over 4 to 10 periods of measure, subject to data availability and comparability.
Health / Nutrition & Healthy Eating
Respondents who don't like the taste of healthy food
Value
Compared to:
Respondents who don't like the taste of healthy food County: Kings
Respondents who don't like the taste of healthy food County: Kings
12.7%
(2023)
Compared to:
Prior Value
(5.7%)
Prior Value compares a measured value with the previously measured value. Confidence intervals were not taken into account in determining the direction of the comparison.
Trend
This comparison measures the indicator’s values over multiple time periods.<br>The Mann-Kendall Test for Statistical Significance is used to evaluate the trend<br>over 4 to 10 periods of measure, subject to data availability and comparability.
Health / Nutrition & Healthy Eating
Respondents who feel healthy food goes bad before they can finish it
Value
Compared to:
Respondents who feel healthy food goes bad before they can finish it County: Kings
Respondents who feel healthy food goes bad before they can finish it County: Kings
30.0%
(2023)
Compared to:
Prior Value
(24.8%)
Prior Value compares a measured value with the previously measured value. Confidence intervals were not taken into account in determining the direction of the comparison.
Trend
This comparison measures the indicator’s values over multiple time periods.<br>The Mann-Kendall Test for Statistical Significance is used to evaluate the trend<br>over 4 to 10 periods of measure, subject to data availability and comparability.
Health / Nutrition & Healthy Eating
Respondents who feel healthy food is too expensive
Value
Compared to:
Respondents who feel healthy food is too expensive County: Kings
Respondents who feel healthy food is too expensive County: Kings
45.7%
(2023)
Compared to:
Prior Value
(44.7%)
Prior Value compares a measured value with the previously measured value. Confidence intervals were not taken into account in determining the direction of the comparison.
Trend
This comparison measures the indicator’s values over multiple time periods.<br>The Mann-Kendall Test for Statistical Significance is used to evaluate the trend<br>over 4 to 10 periods of measure, subject to data availability and comparability.
Health / Nutrition & Healthy Eating
Respondents who feel there are no places to buy healthy food near their home
Value
Compared to:
Respondents who feel there are no places to buy healthy food near their home County: Kings
Respondents who feel there are no places to buy healthy food near their home County: Kings
12.6%
(2023)
Compared to:
Prior Value
(13.0%)
Prior Value compares a measured value with the previously measured value. Confidence intervals were not taken into account in determining the direction of the comparison.
Trend
This comparison measures the indicator’s values over multiple time periods.<br>The Mann-Kendall Test for Statistical Significance is used to evaluate the trend<br>over 4 to 10 periods of measure, subject to data availability and comparability.
Health / Nutrition & Healthy Eating
Respondents who need assistance with nutrition education
Value
Compared to:
Respondents who need assistance with nutrition education County: Kings
Respondents who need assistance with nutrition education County: Kings
12.5%
(2023)
Compared to:
Prior Value
(10.6%)
Prior Value compares a measured value with the previously measured value. Confidence intervals were not taken into account in determining the direction of the comparison.
Health / Nutrition & Healthy Eating
Respondents who Stated They Eat Healthy Food Most of the Time
Value
Compared to:
Respondents who Stated They Eat Healthy Food Most of the Time County: Kings
Respondents who Stated They Eat Healthy Food Most of the Time County: Kings
20.2%
(2023)
Compared to:

Prior Value
(41.9%)
Prior Value compares a measured value with the previously measured value. Confidence intervals were not taken into account in determining the direction of the comparison.
Trend
This comparison measures the indicator’s values over multiple time periods.<br>The Mann-Kendall Test for Statistical Significance is used to evaluate the trend<br>over 4 to 10 periods of measure, subject to data availability and comparability.
Kings County 2023 Target
(72.9%)
Health / Nutrition & Healthy Eating
Respondents whose family doesn't like healthy food
Value
Compared to:
Respondents whose family doesn't like healthy food County: Kings
Respondents whose family doesn't like healthy food County: Kings
9.2%
(2023)
Compared to:
Prior Value
(10.2%)
Prior Value compares a measured value with the previously measured value. Confidence intervals were not taken into account in determining the direction of the comparison.
Trend
This comparison measures the indicator’s values over multiple time periods.<br>The Mann-Kendall Test for Statistical Significance is used to evaluate the trend<br>over 4 to 10 periods of measure, subject to data availability and comparability.
Community / Children's Social Environment
Community / Children's Social Environment
Respondents who need assistance with youth activities
Value
Compared to:
Respondents who need assistance with youth activities County: Kings
Respondents who need assistance with youth activities County: Kings
11.6%
(2023)
Compared to:
Prior Value
(14.7%)
Prior Value compares a measured value with the previously measured value. Confidence intervals were not taken into account in determining the direction of the comparison.
Community / Community & Business Resources
Community / Community & Business Resources
Respondents who turn to a counselor in times of crisis
Value
Compared to:
Respondents who turn to a counselor in times of crisis County: Kings
Respondents who turn to a counselor in times of crisis County: Kings
23.3%
(2023)
Compared to:
Prior Value
(16.6%)
Prior Value compares a measured value with the previously measured value. Confidence intervals were not taken into account in determining the direction of the comparison.
Community / Community & Business Resources
Respondents who turn to a doctor in times of crisis
Value
Compared to:
Respondents who turn to a doctor in times of crisis County: Kings
Respondents who turn to a doctor in times of crisis County: Kings
17.3%
(2023)
Compared to:
Prior Value
(12.2%)
Prior Value compares a measured value with the previously measured value. Confidence intervals were not taken into account in determining the direction of the comparison.
Community / Community & Business Resources
Respondents who turn to a school/education facility in times of crisis
Value
Compared to:
Respondents who turn to a school/education facility in times of crisis County: Kings
Respondents who turn to a school/education facility in times of crisis County: Kings
6.7%
(2023)
Compared to:
Prior Value
(2.9%)
Prior Value compares a measured value with the previously measured value. Confidence intervals were not taken into account in determining the direction of the comparison.
Community / Community & Business Resources
Respondents who turn to law enforcement in times of crisis
Value
Compared to:
Respondents who turn to law enforcement in times of crisis County: Kings
Respondents who turn to law enforcement in times of crisis County: Kings
17.6%
(2023)
Compared to:
Prior Value
(10.8%)
Prior Value compares a measured value with the previously measured value. Confidence intervals were not taken into account in determining the direction of the comparison.
Community / Community & Business Resources
Respondents who turn to social services in times of crisis
Value
Compared to:
Respondents who turn to social services in times of crisis County: Kings
Respondents who turn to social services in times of crisis County: Kings
27.0%
(2023)
Compared to:
Prior Value
(14.3%)
Prior Value compares a measured value with the previously measured value. Confidence intervals were not taken into account in determining the direction of the comparison.
Community / Community & Business Resources
Respondents who turn to the job training office in times of crisis
Value
Compared to:
Respondents who turn to the job training office in times of crisis County: Kings
Respondents who turn to the job training office in times of crisis County: Kings
14.5%
(2023)
Compared to:
Prior Value
(7.0%)
Prior Value compares a measured value with the previously measured value. Confidence intervals were not taken into account in determining the direction of the comparison.
Community / Crime & Crime Prevention
Community / Crime & Crime Prevention
Respondents who need assistance with working with law enforcement
Value
Compared to:
Respondents who need assistance with working with law enforcement County: Kings
Respondents who need assistance with working with law enforcement County: Kings
10.5%
(2023)
Compared to:
Prior Value
(2.0%)
Prior Value compares a measured value with the previously measured value. Confidence intervals were not taken into account in determining the direction of the comparison.
Community / Demographics
Respondents between 18-24 Years Old County: Kings
Respondents between 18-24 Years Old County: Kings
7.2%
(2023)
Compared to:
Prior Value
(5.3%)
Prior Value compares a measured value with the previously measured value. Confidence intervals were not taken into account in determining the direction of the comparison.
Trend
This comparison measures the indicator’s values over multiple time periods.<br>The Mann-Kendall Test for Statistical Significance is used to evaluate the trend<br>over 4 to 10 periods of measure, subject to data availability and comparability.
Respondents who Answered in English County: Kings
Respondents who Answered in English County: Kings
96.9%
(2023)
Compared to:

Prior Value
(90.3%)
Prior Value compares a measured value with the previously measured value. Confidence intervals were not taken into account in determining the direction of the comparison.
Trend
This comparison measures the indicator’s values over multiple time periods.<br>The Mann-Kendall Test for Statistical Significance is used to evaluate the trend<br>over 4 to 10 periods of measure, subject to data availability and comparability.
Community / Demographics
Respondents who Have Completed a Bachelor's Degree or Higher
Value
Compared to:
Respondents who Have Completed a Bachelor's Degree or Higher County: Kings
Respondents who Have Completed a Bachelor's Degree or Higher County: Kings
34.4%
(2023)
Compared to:
Prior Value
(30.2%)
Prior Value compares a measured value with the previously measured value. Confidence intervals were not taken into account in determining the direction of the comparison.
Kings County 2023 Target
(33.2%)
Respondents who Identify as Male County: Kings
Respondents who Identify as Male County: Kings
32.6%
(2023)
Compared to:
Prior Value
(13.4%)
Prior Value compares a measured value with the previously measured value. Confidence intervals were not taken into account in determining the direction of the comparison.
Trend
This comparison measures the indicator’s values over multiple time periods.<br>The Mann-Kendall Test for Statistical Significance is used to evaluate the trend<br>over 4 to 10 periods of measure, subject to data availability and comparability.
Respondents who Live in Hanford County: Kings
Respondents who Live in Hanford County: Kings
39.4%
(2023)
Compared to:

Prior Value
(47.6%)
Prior Value compares a measured value with the previously measured value. Confidence intervals were not taken into account in determining the direction of the comparison.
Trend
This comparison measures the indicator’s values over multiple time periods.<br>The Mann-Kendall Test for Statistical Significance is used to evaluate the trend<br>over 4 to 10 periods of measure, subject to data availability and comparability.
Community / Domestic Violence & Abuse
Community / Domestic Violence & Abuse
Respondents who Have Been Victims of Violence in their Homes
Value
Compared to:
Respondents who Have Been Victims of Violence in their Homes County: Kings
Respondents who Have Been Victims of Violence in their Homes County: Kings
34.7%
(2023)
Compared to:
Prior Value
(11.6%)
Prior Value compares a measured value with the previously measured value. Confidence intervals were not taken into account in determining the direction of the comparison.
Trend
This comparison measures the indicator’s values over multiple time periods.<br>The Mann-Kendall Test for Statistical Significance is used to evaluate the trend<br>over 4 to 10 periods of measure, subject to data availability and comparability.
Kings County 2023 Target
(11.7%)
Community / Domestic Violence & Abuse
Respondents who Have Used Victim Services in the Community
Value
Compared to:
Respondents who Have Used Victim Services in the Community County: Kings
Respondents who Have Used Victim Services in the Community County: Kings
18.2%
(2023)
Compared to:

Prior Value
(5.2%)
Prior Value compares a measured value with the previously measured value. Confidence intervals were not taken into account in determining the direction of the comparison.
Trend
This comparison measures the indicator’s values over multiple time periods.<br>The Mann-Kendall Test for Statistical Significance is used to evaluate the trend<br>over 4 to 10 periods of measure, subject to data availability and comparability.
Community / Domestic Violence & Abuse
Respondents Who Have Witnessed Violence In their Home
Value
Compared to:
Respondents Who Have Witnessed Violence In their Home County: Kings
Respondents Who Have Witnessed Violence In their Home County: Kings
37.4%
(2023)
Compared to:
Prior Value
(13.4%)
Prior Value compares a measured value with the previously measured value. Confidence intervals were not taken into account in determining the direction of the comparison.
Trend
This comparison measures the indicator’s values over multiple time periods.<br>The Mann-Kendall Test for Statistical Significance is used to evaluate the trend<br>over 4 to 10 periods of measure, subject to data availability and comparability.
Kings County 2023 Target
(11.5%)
Community / Family Structure
Community / Family Structure
Respondents who Have Used Family and Parenting Services in the Community
Value
Compared to:
Respondents who Have Used Family and Parenting Services in the Community County: Kings
Respondents who Have Used Family and Parenting Services in the Community County: Kings
22.9%
(2023)
Compared to:
Prior Value
(8.7%)
Prior Value compares a measured value with the previously measured value. Confidence intervals were not taken into account in determining the direction of the comparison.
Trend
This comparison measures the indicator’s values over multiple time periods.<br>The Mann-Kendall Test for Statistical Significance is used to evaluate the trend<br>over 4 to 10 periods of measure, subject to data availability and comparability.
Respondents who Live Alone County: Kings
Respondents who Live Alone County: Kings
4.4%
(2023)
Compared to:
Prior Value
(5.6%)
Prior Value compares a measured value with the previously measured value. Confidence intervals were not taken into account in determining the direction of the comparison.
Trend
This comparison measures the indicator’s values over multiple time periods.<br>The Mann-Kendall Test for Statistical Significance is used to evaluate the trend<br>over 4 to 10 periods of measure, subject to data availability and comparability.
Community / Family Structure
Respondents who need assistance with parenting classes
Value
Compared to:
Respondents who need assistance with parenting classes County: Kings
Respondents who need assistance with parenting classes County: Kings
8.5%
(2023)
Compared to:
Prior Value
(5.0%)
Prior Value compares a measured value with the previously measured value. Confidence intervals were not taken into account in determining the direction of the comparison.
Respondents with 3-5 people in their household County: Kings
Respondents with 3-5 people in their household County: Kings
65.3%
(2023)
Compared to:
Prior Value
(54.0%)
Prior Value compares a measured value with the previously measured value. Confidence intervals were not taken into account in determining the direction of the comparison.
Trend
This comparison measures the indicator’s values over multiple time periods.<br>The Mann-Kendall Test for Statistical Significance is used to evaluate the trend<br>over 4 to 10 periods of measure, subject to data availability and comparability.
Community / Family Structure
Respondents with 6 or more people in their household
Value
Compared to:
Respondents with 6 or more people in their household County: Kings
Respondents with 6 or more people in their household County: Kings
14.4%
(2023)
Compared to:
Prior Value
(8.6%)
Prior Value compares a measured value with the previously measured value. Confidence intervals were not taken into account in determining the direction of the comparison.
Trend
This comparison measures the indicator’s values over multiple time periods.<br>The Mann-Kendall Test for Statistical Significance is used to evaluate the trend<br>over 4 to 10 periods of measure, subject to data availability and comparability.
Community / Public Safety
Community / Public Safety
Respondents Who Have Been Victims of Violence Their Community
Value
Compared to:
Respondents Who Have Been Victims of Violence Their Community County: Kings
Respondents Who Have Been Victims of Violence Their Community County: Kings
41.1%
(2023)
Compared to:
Prior Value
(13.3%)
Prior Value compares a measured value with the previously measured value. Confidence intervals were not taken into account in determining the direction of the comparison.
Trend
This comparison measures the indicator’s values over multiple time periods.<br>The Mann-Kendall Test for Statistical Significance is used to evaluate the trend<br>over 4 to 10 periods of measure, subject to data availability and comparability.
Kings County 2023 Target
(14.9%)
Community / Public Safety
Respondents who Have Witnessed Violence their Community
Value
Compared to:
Respondents who Have Witnessed Violence their Community County: Kings
Respondents who Have Witnessed Violence their Community County: Kings
62.4%
(2023)
Compared to:
Prior Value
(40.4%)
Prior Value compares a measured value with the previously measured value. Confidence intervals were not taken into account in determining the direction of the comparison.
Trend
This comparison measures the indicator’s values over multiple time periods.<br>The Mann-Kendall Test for Statistical Significance is used to evaluate the trend<br>over 4 to 10 periods of measure, subject to data availability and comparability.
Kings County 2023 Target
(32.2%)
Community / Public Transportation
Community / Public Transportation
Respondents who Believe Public Transportation does not Meet Their Needs
Value
Compared to:
Respondents who Believe Public Transportation does not Meet Their Needs County: Kings
Respondents who Believe Public Transportation does not Meet Their Needs County: Kings
16.9%
(2023)
Compared to:
Prior Value
(19.3%)
Prior Value compares a measured value with the previously measured value. Confidence intervals were not taken into account in determining the direction of the comparison.
Trend
This comparison measures the indicator’s values over multiple time periods.<br>The Mann-Kendall Test for Statistical Significance is used to evaluate the trend<br>over 4 to 10 periods of measure, subject to data availability and comparability.
Kings County 2023 Target
(29.4%)
Community / Public Transportation
Respondents who feel public transportation has limited locations
Value
Compared to:
Respondents who feel public transportation has limited locations County: Kings
Respondents who feel public transportation has limited locations County: Kings
42.3%
(2023)
Compared to:
Prior Value
(45.8%)
Prior Value compares a measured value with the previously measured value. Confidence intervals were not taken into account in determining the direction of the comparison.
Community / Public Transportation
Respondents who feel public transportation has limited times
Value
Compared to:
Respondents who feel public transportation has limited times County: Kings
Respondents who feel public transportation has limited times County: Kings
44.0%
(2023)
Compared to:
Prior Value
(49.1%)
Prior Value compares a measured value with the previously measured value. Confidence intervals were not taken into account in determining the direction of the comparison.
Trend
This comparison measures the indicator’s values over multiple time periods.<br>The Mann-Kendall Test for Statistical Significance is used to evaluate the trend<br>over 4 to 10 periods of measure, subject to data availability and comparability.
Community / Public Transportation
Respondents who feel public transportation has long wait times
Value
Compared to:
Respondents who feel public transportation has long wait times County: Kings
Respondents who feel public transportation has long wait times County: Kings
39.3%
(2023)
Compared to:
Prior Value
(34.1%)
Prior Value compares a measured value with the previously measured value. Confidence intervals were not taken into account in determining the direction of the comparison.
Trend
This comparison measures the indicator’s values over multiple time periods.<br>The Mann-Kendall Test for Statistical Significance is used to evaluate the trend<br>over 4 to 10 periods of measure, subject to data availability and comparability.
Community / Public Transportation
Respondents who feel public transportation has scheduling conflicts
Value
Compared to:
Respondents who feel public transportation has scheduling conflicts County: Kings
Respondents who feel public transportation has scheduling conflicts County: Kings
30.9%
(2023)
Compared to:
Prior Value
(23.8%)
Prior Value compares a measured value with the previously measured value. Confidence intervals were not taken into account in determining the direction of the comparison.
Trend
This comparison measures the indicator’s values over multiple time periods.<br>The Mann-Kendall Test for Statistical Significance is used to evaluate the trend<br>over 4 to 10 periods of measure, subject to data availability and comparability.
Community / Public Transportation
Respondents who feel public transportation is too expensive
Value
Compared to:
Respondents who feel public transportation is too expensive County: Kings
Respondents who feel public transportation is too expensive County: Kings
20.5%
(2023)
Compared to:
Prior Value
(14.0%)
Prior Value compares a measured value with the previously measured value. Confidence intervals were not taken into account in determining the direction of the comparison.
Trend
This comparison measures the indicator’s values over multiple time periods.<br>The Mann-Kendall Test for Statistical Significance is used to evaluate the trend<br>over 4 to 10 periods of measure, subject to data availability and comparability.
Community / Religion & Spirituality
Community / Religion & Spirituality
Respondents who are interested in joining a church or spiritual community
Value
Compared to:
Respondents who are interested in joining a church or spiritual community County: Kings
Respondents who are interested in joining a church or spiritual community County: Kings
52.1%
(2023)
Compared to:
Prior Value
(27.5%)
Prior Value compares a measured value with the previously measured value. Confidence intervals were not taken into account in determining the direction of the comparison.
Trend
This comparison measures the indicator’s values over multiple time periods.<br>The Mann-Kendall Test for Statistical Significance is used to evaluate the trend<br>over 4 to 10 periods of measure, subject to data availability and comparability.
Community / Religion & Spirituality
Respondents who Attend a Church or Religious Organization Regularly
Value
Compared to:
Respondents who Attend a Church or Religious Organization Regularly County: Kings
Respondents who Attend a Church or Religious Organization Regularly County: Kings
60.6%
(2023)
Compared to:
Prior Value
(49.4%)
Prior Value compares a measured value with the previously measured value. Confidence intervals were not taken into account in determining the direction of the comparison.
Trend
This comparison measures the indicator’s values over multiple time periods.<br>The Mann-Kendall Test for Statistical Significance is used to evaluate the trend<br>over 4 to 10 periods of measure, subject to data availability and comparability.
Kings County 2023 Target
(65.6%)
Community / Religion & Spirituality
Respondents Who Feel There Are Enough Opportunities and Organizations to Meet Their Spiritual Needs
Value
Compared to:
Respondents Who Feel There Are Enough Opportunities and Organizations to Meet Their Spiritual Needs County: Kings
Respondents Who Feel There Are Enough Opportunities and Organizations to Meet Their Spiritual Needs County: Kings
68.6%
(2023)
Compared to:
Prior Value
(65.9%)
Prior Value compares a measured value with the previously measured value. Confidence intervals were not taken into account in determining the direction of the comparison.
Trend
This comparison measures the indicator’s values over multiple time periods.<br>The Mann-Kendall Test for Statistical Significance is used to evaluate the trend<br>over 4 to 10 periods of measure, subject to data availability and comparability.
Kings County 2023 Target
(72.0%)
Community / Religion & Spirituality
Respondents who Turn to a Church or Spiritual Community in Times of Crisis
Value
Compared to:
Respondents who Turn to a Church or Spiritual Community in Times of Crisis County: Kings
Respondents who Turn to a Church or Spiritual Community in Times of Crisis County: Kings
24.6%
(2023)
Compared to:
Prior Value
(35.3%)
Prior Value compares a measured value with the previously measured value. Confidence intervals were not taken into account in determining the direction of the comparison.
Community / Social Environment
Community / Social Environment
Respondents who stated their internet connection is not reliable
Value
Compared to:
Respondents who stated their internet connection is not reliable County: Kings
Respondents who stated their internet connection is not reliable County: Kings
12.0%
(2023)
Compared to:
Prior Value
(17.3%)
Prior Value compares a measured value with the previously measured value. Confidence intervals were not taken into account in determining the direction of the comparison.
Respondents who Stated they Have a Home Computer County: Kings
Respondents who Stated they Have a Home Computer County: Kings
78.7%
(2023)
Compared to:
Prior Value
(77.7%)
Prior Value compares a measured value with the previously measured value. Confidence intervals were not taken into account in determining the direction of the comparison.
Trend
This comparison measures the indicator’s values over multiple time periods.<br>The Mann-Kendall Test for Statistical Significance is used to evaluate the trend<br>over 4 to 10 periods of measure, subject to data availability and comparability.
Kings County 2023 Target
(58.0%)
Community / Social Environment
Respondents who Stated they Have a Smartphone in their Household
Value
Compared to:
Respondents who Stated they Have a Smartphone in their Household County: Kings
Respondents who Stated they Have a Smartphone in their Household County: Kings
92.9%
(2023)
Compared to:
Prior Value
(95.2%)
Prior Value compares a measured value with the previously measured value. Confidence intervals were not taken into account in determining the direction of the comparison.
Trend
This comparison measures the indicator’s values over multiple time periods.<br>The Mann-Kendall Test for Statistical Significance is used to evaluate the trend<br>over 4 to 10 periods of measure, subject to data availability and comparability.
Kings County 2023 Target
(88.0%)
Community / Social Environment
Respondents who use a cable company for their internet
Value
Compared to:
Respondents who use a cable company for their internet County: Kings
Respondents who use a cable company for their internet County: Kings
81.9%
(2023)
Compared to:
Prior Value
(89.2%)
Prior Value compares a measured value with the previously measured value. Confidence intervals were not taken into account in determining the direction of the comparison.
Community / Social Environment
Respondents who use a data plan through a mobile device for their internet
Value
Compared to:
Respondents who use a data plan through a mobile device for their internet County: Kings
Respondents who use a data plan through a mobile device for their internet County: Kings
13.9%
(2023)
Compared to:
Prior Value
(10.0%)
Prior Value compares a measured value with the previously measured value. Confidence intervals were not taken into account in determining the direction of the comparison.
Respondents who use KingsNet for their internet County: Kings
Respondents who use KingsNet for their internet County: Kings
18.9%
(2023)
Compared to:
Prior Value
(5.6%)
Prior Value compares a measured value with the previously measured value. Confidence intervals were not taken into account in determining the direction of the comparison.
Community / Social Services
Respondents who are aware of 2-1-1 resources County: Kings
Respondents who are aware of 2-1-1 resources County: Kings
12.6%
(2023)
Compared to:
Prior Value
(25.7%)
Prior Value compares a measured value with the previously measured value. Confidence intervals were not taken into account in determining the direction of the comparison.
Respondents who are aware of Champions resources County: Kings
Respondents who are aware of Champions resources County: Kings
25.9%
(2023)
Compared to:
Prior Value
(12.9%)
Prior Value compares a measured value with the previously measured value. Confidence intervals were not taken into account in determining the direction of the comparison.
Community / Social Services
Respondents who are aware of church or spiritual community resources
Value
Compared to:
Respondents who are aware of church or spiritual community resources County: Kings
Respondents who are aware of church or spiritual community resources County: Kings
41.4%
(2023)
Compared to:
Prior Value
(35.6%)
Prior Value compares a measured value with the previously measured value. Confidence intervals were not taken into account in determining the direction of the comparison.
Community / Social Services
Respondents who are aware of emergency room resources
Value
Compared to:
Respondents who are aware of emergency room resources County: Kings
Respondents who are aware of emergency room resources County: Kings
28.4%
(2023)
Compared to:
Prior Value
(38.6%)
Prior Value compares a measured value with the previously measured value. Confidence intervals were not taken into account in determining the direction of the comparison.
Community / Social Services
Respondents who are aware of Kings County Behavioral Health resources
Value
Compared to:
Respondents who are aware of Kings County Behavioral Health resources County: Kings
Respondents who are aware of Kings County Behavioral Health resources County: Kings
43.2%
(2023)
Compared to:
Prior Value
(38.6%)
Prior Value compares a measured value with the previously measured value. Confidence intervals were not taken into account in determining the direction of the comparison.
Respondents who are aware of Kings View resources County: Kings
Respondents who are aware of Kings View resources County: Kings
33.5%
(2023)
Compared to:
Prior Value
(36.6%)
Prior Value compares a measured value with the previously measured value. Confidence intervals were not taken into account in determining the direction of the comparison.
Community / Social Services
Respondents who are aware of the suicide hotline resources
Value
Compared to:
Respondents who are aware of the suicide hotline resources County: Kings
Respondents who are aware of the suicide hotline resources County: Kings
42.1%
(2023)
Compared to:
Prior Value
(57.4%)
Prior Value compares a measured value with the previously measured value. Confidence intervals were not taken into account in determining the direction of the comparison.
Respondents who are aware of urgent care resources County: Kings
Respondents who are aware of urgent care resources County: Kings
35.6%
(2023)
Compared to:
Prior Value
(34.7%)
Prior Value compares a measured value with the previously measured value. Confidence intervals were not taken into account in determining the direction of the comparison.
Respondents who are aware of Warm Line resources County: Kings
Respondents who are aware of Warm Line resources County: Kings
31.3%
(2023)
Compared to:
Prior Value
(15.8%)
Prior Value compares a measured value with the previously measured value. Confidence intervals were not taken into account in determining the direction of the comparison.
Community / Social Services
Respondents who Have Used Veteran Services in the Community
Value
Compared to:
Respondents who Have Used Veteran Services in the Community County: Kings
Respondents who Have Used Veteran Services in the Community County: Kings
11.9%
(2023)
Compared to:
Prior Value
(5.0%)
Prior Value compares a measured value with the previously measured value. Confidence intervals were not taken into account in determining the direction of the comparison.
No Comparison Data Available
(100%)
Community / Social Services
Respondents who Receive Services from Kings Community Action Organization
Value
Compared to:
Respondents who Receive Services from Kings Community Action Organization County: Kings
Respondents who Receive Services from Kings Community Action Organization County: Kings
44.9%
(2023)
Compared to:
Prior Value
(10.8%)
Prior Value compares a measured value with the previously measured value. Confidence intervals were not taken into account in determining the direction of the comparison.
Trend
This comparison measures the indicator’s values over multiple time periods.<br>The Mann-Kendall Test for Statistical Significance is used to evaluate the trend<br>over 4 to 10 periods of measure, subject to data availability and comparability.
Community / Transportation
Respondents who need assistance with transportation County: Kings
Respondents who need assistance with transportation County: Kings
13.5%
(2023)
Compared to:
Prior Value
(4.4%)
Prior Value compares a measured value with the previously measured value. Confidence intervals were not taken into account in determining the direction of the comparison.
Respondents who use Amtrak train County: Kings
Respondents who use Amtrak train County: Kings
42.8%
(2023)
Compared to:
Prior Value
(37.6%)
Prior Value compares a measured value with the previously measured value. Confidence intervals were not taken into account in determining the direction of the comparison.
Trend
This comparison measures the indicator’s values over multiple time periods.<br>The Mann-Kendall Test for Statistical Significance is used to evaluate the trend<br>over 4 to 10 periods of measure, subject to data availability and comparability.
Respondents who use Corcoran Area Transit (CAT) bus County: Kings
Respondents who use Corcoran Area Transit (CAT) bus County: Kings
20.5%
(2023)
Compared to:
Prior Value
(17.0%)
Prior Value compares a measured value with the previously measured value. Confidence intervals were not taken into account in determining the direction of the comparison.
Trend
This comparison measures the indicator’s values over multiple time periods.<br>The Mann-Kendall Test for Statistical Significance is used to evaluate the trend<br>over 4 to 10 periods of measure, subject to data availability and comparability.
Community / Transportation
Respondents who use Kings Area Rural Transit (KART) Bus
Value
Compared to:
Respondents who use Kings Area Rural Transit (KART) Bus County: Kings
Respondents who use Kings Area Rural Transit (KART) Bus County: Kings
73.0%
(2023)
Compared to:
Prior Value
(70.7%)
Prior Value compares a measured value with the previously measured value. Confidence intervals were not taken into account in determining the direction of the comparison.
Trend
This comparison measures the indicator’s values over multiple time periods.<br>The Mann-Kendall Test for Statistical Significance is used to evaluate the trend<br>over 4 to 10 periods of measure, subject to data availability and comparability.
Economy / Employment
Economy / Employment
Respondents Who Feel a Lack of Job Skills Have Prevented Them From Obtaining a Job
Value
Compared to:
Respondents Who Feel a Lack of Job Skills Have Prevented Them From Obtaining a Job County: Kings
Respondents Who Feel a Lack of Job Skills Have Prevented Them From Obtaining a Job County: Kings
39.7
(2023)
Compared to:
Prior Value
(24.5)
Prior Value compares a measured value with the previously measured value. Confidence intervals were not taken into account in determining the direction of the comparison.
Trend
This comparison measures the indicator’s values over multiple time periods.<br>The Mann-Kendall Test for Statistical Significance is used to evaluate the trend<br>over 4 to 10 periods of measure, subject to data availability and comparability.
Kings County 2023 Target
(24.0)
Economy / Employment
Respondents who feel a lack of job skills or education have prevented anyone in their household from obtaining a better paying job
Value
Compared to:
Respondents who feel a lack of job skills or education have prevented anyone in their household from obtaining a better paying job County: Kings
Respondents who feel a lack of job skills or education have prevented anyone in their household from obtaining a better paying job County: Kings
44.9%
(2023)
Compared to:
Prior Value
(59.1%)
Prior Value compares a measured value with the previously measured value. Confidence intervals were not taken into account in determining the direction of the comparison.
Trend
This comparison measures the indicator’s values over multiple time periods.<br>The Mann-Kendall Test for Statistical Significance is used to evaluate the trend<br>over 4 to 10 periods of measure, subject to data availability and comparability.
Economy / Employment
Respondents Who Had a Member of the Household Experience a Sudden Loss of Income In the Last Two Years
Value
Compared to:
Respondents Who Had a Member of the Household Experience a Sudden Loss of Income In the Last Two Years County: Kings
Respondents Who Had a Member of the Household Experience a Sudden Loss of Income In the Last Two Years County: Kings
46.8%
(2023)
Compared to:
Prior Value
(34.2%)
Prior Value compares a measured value with the previously measured value. Confidence intervals were not taken into account in determining the direction of the comparison.
Kings County 2023 Target
(30.8%)
Respondents who need assistance with employment County: Kings
Respondents who need assistance with employment County: Kings
18.0%
(2023)
Compared to:
Prior Value
(15.7%)
Prior Value compares a measured value with the previously measured value. Confidence intervals were not taken into account in determining the direction of the comparison.
Respondents who need assistance with job training County: Kings
Respondents who need assistance with job training County: Kings
16.1%
(2023)
Compared to:
Prior Value
(10.4%)
Prior Value compares a measured value with the previously measured value. Confidence intervals were not taken into account in determining the direction of the comparison.
Economy / Employment
Respondents Whose Household Experienced a Major Change in Income
Value
Compared to:
Respondents Whose Household Experienced a Major Change in Income County: Kings
Respondents Whose Household Experienced a Major Change in Income County: Kings
61.0%
Percent of respondents
(2023)
Compared to:
Prior Value
(48.4%)
Prior Value compares a measured value with the previously measured value. Confidence intervals were not taken into account in determining the direction of the comparison.
No Comparison Data Available
(0%)
Economy / Employment
Respondents whose Household Experienced Reduced Work Hours of Wages due to the COVID Pandemic
Value
Compared to:
Respondents whose Household Experienced Reduced Work Hours of Wages due to the COVID Pandemic County: Kings
Respondents whose Household Experienced Reduced Work Hours of Wages due to the COVID Pandemic County: Kings
24.4%
(2021)
Compared to:
No Comparison Data Available
(0%)
Economy / Food Insecurity
Economy / Food Insecurity
Respondents Who Feel They Are Able to Access Food Within Their Community
Value
Compared to:
Respondents Who Feel They Are Able to Access Food Within Their Community County: Kings
Respondents Who Feel They Are Able to Access Food Within Their Community County: Kings
90.8%
(2023)
Compared to:
Prior Value
(92.0%)
Prior Value compares a measured value with the previously measured value. Confidence intervals were not taken into account in determining the direction of the comparison.
Kings County 2023 Target
(100%)
Economy / Food Insecurity
Respondents Who Feel They Won't Have Enough Food to Feed Their Family
Value
Compared to:
Respondents Who Feel They Won't Have Enough Food to Feed Their Family County: Kings
Respondents Who Feel They Won't Have Enough Food to Feed Their Family County: Kings
43.1%
(2023)
Compared to:
Prior Value
(18.4%)
Prior Value compares a measured value with the previously measured value. Confidence intervals were not taken into account in determining the direction of the comparison.
Trend
This comparison measures the indicator’s values over multiple time periods.<br>The Mann-Kendall Test for Statistical Significance is used to evaluate the trend<br>over 4 to 10 periods of measure, subject to data availability and comparability.
Kings County 2023 Target
(30.0%)
Economy / Food Insecurity
Respondents who Have Used Food Assistance in the Community
Value
Compared to:
Respondents who Have Used Food Assistance in the Community County: Kings
Respondents who Have Used Food Assistance in the Community County: Kings
39.7%
(2023)
Compared to:
Prior Value
(35.5%)
Prior Value compares a measured value with the previously measured value. Confidence intervals were not taken into account in determining the direction of the comparison.
Trend
This comparison measures the indicator’s values over multiple time periods.<br>The Mann-Kendall Test for Statistical Significance is used to evaluate the trend<br>over 4 to 10 periods of measure, subject to data availability and comparability.
Respondents who need assistance with food County: Kings
Respondents who need assistance with food County: Kings
22.3%
(2023)
Compared to:
Prior Value
(16.9%)
Prior Value compares a measured value with the previously measured value. Confidence intervals were not taken into account in determining the direction of the comparison.
Economy / Housing & Homes
Economy / Housing & Homes
Respondents who Need Assistance with Affordable Housing
Value
Compared to:
Respondents who Need Assistance with Affordable Housing County: Kings
Respondents who Need Assistance with Affordable Housing County: Kings
24.6%
(2023)
Compared to:
Prior Value
(18.1%)
Prior Value compares a measured value with the previously measured value. Confidence intervals were not taken into account in determining the direction of the comparison.
No Comparison Data Available
(0%)
Respondents with 1-2 people in their household County: Kings
Respondents with 1-2 people in their household County: Kings
19.8%
(2023)
Compared to:
Prior Value
(28.4%)
Prior Value compares a measured value with the previously measured value. Confidence intervals were not taken into account in determining the direction of the comparison.
Trend
This comparison measures the indicator’s values over multiple time periods.<br>The Mann-Kendall Test for Statistical Significance is used to evaluate the trend<br>over 4 to 10 periods of measure, subject to data availability and comparability.
Economy / Housing Affordability & Supply
Economy / Housing Affordability & Supply
Respondents who are Currently Having Trouble Paying Rent or Mortgage
Value
Compared to:
Respondents who are Currently Having Trouble Paying Rent or Mortgage County: Kings
Respondents who are Currently Having Trouble Paying Rent or Mortgage County: Kings
43.0%
(2023)
Compared to:
Prior Value
(13.6%)
Prior Value compares a measured value with the previously measured value. Confidence intervals were not taken into account in determining the direction of the comparison.
Kings County 2023 Target
(21.0%)
Economy / Housing Affordability & Supply
Respondents Who Are Having Trouble Affording an Apartment or House in Their Community
Value
Compared to:
Respondents Who Are Having Trouble Affording an Apartment or House in Their Community County: Kings
Respondents Who Are Having Trouble Affording an Apartment or House in Their Community County: Kings
59.1%
(2023)
Compared to:
Prior Value
(23.6%)
Prior Value compares a measured value with the previously measured value. Confidence intervals were not taken into account in determining the direction of the comparison.
Trend
This comparison measures the indicator’s values over multiple time periods.<br>The Mann-Kendall Test for Statistical Significance is used to evaluate the trend<br>over 4 to 10 periods of measure, subject to data availability and comparability.
Kings County 2023 Target
(32.0%)
Economy / Housing Affordability & Supply
Respondents Who Are Having Trouble Paying Their Utility Bills
Value
Compared to:
Respondents Who Are Having Trouble Paying Their Utility Bills County: Kings
Respondents Who Are Having Trouble Paying Their Utility Bills County: Kings
45.7%
(2023)
Compared to:
Prior Value
(18.1%)
Prior Value compares a measured value with the previously measured value. Confidence intervals were not taken into account in determining the direction of the comparison.
Trend
This comparison measures the indicator’s values over multiple time periods.<br>The Mann-Kendall Test for Statistical Significance is used to evaluate the trend<br>over 4 to 10 periods of measure, subject to data availability and comparability.
Kings County 2023 Target
(28.0%)
Economy / Housing Affordability & Supply
Respondents who currently live in a shared housing situation due to lack of affordable housing
Value
Compared to:
Respondents who currently live in a shared housing situation due to lack of affordable housing County: Kings
Respondents who currently live in a shared housing situation due to lack of affordable housing County: Kings
44.7%
(2023)
Compared to:
No Comparison Data Available
(0%)
Economy / Housing Affordability & Supply
Respondents who need assistance with home repairs
Value
Compared to:
Respondents who need assistance with home repairs County: Kings
Respondents who need assistance with home repairs County: Kings
12.4%
(2023)
Compared to:
Prior Value
(18.9%)
Prior Value compares a measured value with the previously measured value. Confidence intervals were not taken into account in determining the direction of the comparison.
Economy / Housing Affordability & Supply
Respondents who need assistance with shelter
Value
Compared to:
Respondents who need assistance with shelter County: Kings
Respondents who need assistance with shelter County: Kings
7.7%
(2023)
Compared to:
Prior Value
(1.2%)
Prior Value compares a measured value with the previously measured value. Confidence intervals were not taken into account in determining the direction of the comparison.
Economy / Housing Affordability & Supply
Respondents who need assistance with utilities assistance
Value
Compared to:
Respondents who need assistance with utilities assistance County: Kings
Respondents who need assistance with utilities assistance County: Kings
20.4%
(2023)
Compared to:
Prior Value
(14.5%)
Prior Value compares a measured value with the previously measured value. Confidence intervals were not taken into account in determining the direction of the comparison.
Economy / Income
Economy / Income
Respondents who reported annual household incomes of $12,000 or less
Value
Compared to:
Respondents who reported annual household incomes of $12,000 or less County: Kings
Respondents who reported annual household incomes of $12,000 or less County: Kings
6.4%
(2023)
Compared to:

Prior Value
(8.5%)
Prior Value compares a measured value with the previously measured value. Confidence intervals were not taken into account in determining the direction of the comparison.
Trend
This comparison measures the indicator’s values over multiple time periods.<br>The Mann-Kendall Test for Statistical Significance is used to evaluate the trend<br>over 4 to 10 periods of measure, subject to data availability and comparability.
Economy / Income
Respondents who reported annual household incomes of between $12,000 to $16,000
Value
Compared to:
Respondents who reported annual household incomes of between $12,000 to $16,000 County: Kings
Respondents who reported annual household incomes of between $12,000 to $16,000 County: Kings
6.0%
(2023)
Compared to:
Prior Value
(5.5%)
Prior Value compares a measured value with the previously measured value. Confidence intervals were not taken into account in determining the direction of the comparison.
Trend
This comparison measures the indicator’s values over multiple time periods.<br>The Mann-Kendall Test for Statistical Significance is used to evaluate the trend<br>over 4 to 10 periods of measure, subject to data availability and comparability.
Economy / Income
Respondents who reported annual household incomes of between $16,000 to $20,000
Value
Compared to:
Respondents who reported annual household incomes of between $16,000 to $20,000 County: Kings
Respondents who reported annual household incomes of between $16,000 to $20,000 County: Kings
5.3%
(2023)
Compared to:
Prior Value
(4.0%)
Prior Value compares a measured value with the previously measured value. Confidence intervals were not taken into account in determining the direction of the comparison.
Trend
This comparison measures the indicator’s values over multiple time periods.<br>The Mann-Kendall Test for Statistical Significance is used to evaluate the trend<br>over 4 to 10 periods of measure, subject to data availability and comparability.
Economy / Income
Respondents who reported annual household incomes of between $20,000 to $25,000
Value
Compared to:
Respondents who reported annual household incomes of between $20,000 to $25,000 County: Kings
Respondents who reported annual household incomes of between $20,000 to $25,000 County: Kings
8.6%
(2023)
Compared to:
Prior Value
(4.6%)
Prior Value compares a measured value with the previously measured value. Confidence intervals were not taken into account in determining the direction of the comparison.
Trend
This comparison measures the indicator’s values over multiple time periods.<br>The Mann-Kendall Test for Statistical Significance is used to evaluate the trend<br>over 4 to 10 periods of measure, subject to data availability and comparability.
Economy / Income
Respondents who reported annual household incomes of between $25,000 to $30,000
Value
Compared to:
Respondents who reported annual household incomes of between $25,000 to $30,000 County: Kings
Respondents who reported annual household incomes of between $25,000 to $30,000 County: Kings
4.1%
(2023)
Compared to:
Prior Value
(7.6%)
Prior Value compares a measured value with the previously measured value. Confidence intervals were not taken into account in determining the direction of the comparison.
Trend
This comparison measures the indicator’s values over multiple time periods.<br>The Mann-Kendall Test for Statistical Significance is used to evaluate the trend<br>over 4 to 10 periods of measure, subject to data availability and comparability.
Economy / Income
Respondents who reported annual household incomes of between $30,000 to $35,000
Value
Compared to:
Respondents who reported annual household incomes of between $30,000 to $35,000 County: Kings
Respondents who reported annual household incomes of between $30,000 to $35,000 County: Kings
6.0%
(2023)
Compared to:
Prior Value
(8.2%)
Prior Value compares a measured value with the previously measured value. Confidence intervals were not taken into account in determining the direction of the comparison.
Trend
This comparison measures the indicator’s values over multiple time periods.<br>The Mann-Kendall Test for Statistical Significance is used to evaluate the trend<br>over 4 to 10 periods of measure, subject to data availability and comparability.
Economy / Income
Respondents who reported annual household incomes of between $35,000 to $40,000
Value
Compared to:
Respondents who reported annual household incomes of between $35,000 to $40,000 County: Kings
Respondents who reported annual household incomes of between $35,000 to $40,000 County: Kings
7.6%
(2023)
Compared to:
Prior Value
(10.1%)
Prior Value compares a measured value with the previously measured value. Confidence intervals were not taken into account in determining the direction of the comparison.
Trend
This comparison measures the indicator’s values over multiple time periods.<br>The Mann-Kendall Test for Statistical Significance is used to evaluate the trend<br>over 4 to 10 periods of measure, subject to data availability and comparability.
Economy / Income
Respondents who reported annual household incomes of between $40,000 to $50,000
Value
Compared to:
Respondents who reported annual household incomes of between $40,000 to $50,000 County: Kings
Respondents who reported annual household incomes of between $40,000 to $50,000 County: Kings
11.6%
(2023)
Compared to:
Prior Value
(12.0%)
Prior Value compares a measured value with the previously measured value. Confidence intervals were not taken into account in determining the direction of the comparison.
Trend
This comparison measures the indicator’s values over multiple time periods.<br>The Mann-Kendall Test for Statistical Significance is used to evaluate the trend<br>over 4 to 10 periods of measure, subject to data availability and comparability.
Economy / Income
Respondents who reported annual household incomes of between $50,000 to $65,000
Value
Compared to:
Respondents who reported annual household incomes of between $50,000 to $65,000 County: Kings
Respondents who reported annual household incomes of between $50,000 to $65,000 County: Kings
12.7%
(2023)
Compared to:
Prior Value
(8.7%)
Prior Value compares a measured value with the previously measured value. Confidence intervals were not taken into account in determining the direction of the comparison.
Trend
This comparison measures the indicator’s values over multiple time periods.<br>The Mann-Kendall Test for Statistical Significance is used to evaluate the trend<br>over 4 to 10 periods of measure, subject to data availability and comparability.
Economy / Income
Respondents who reported annual household incomes of between $65,000 to $80,000
Value
Compared to:
Respondents who reported annual household incomes of between $65,000 to $80,000 County: Kings
Respondents who reported annual household incomes of between $65,000 to $80,000 County: Kings
12.3%
(2023)
Compared to:
Prior Value
(10.3%)
Prior Value compares a measured value with the previously measured value. Confidence intervals were not taken into account in determining the direction of the comparison.
Trend
This comparison measures the indicator’s values over multiple time periods.<br>The Mann-Kendall Test for Statistical Significance is used to evaluate the trend<br>over 4 to 10 periods of measure, subject to data availability and comparability.
Economy / Income
Respondents who reported annual household incomes of between $80,000 to $100,000
Value
Compared to:
Respondents who reported annual household incomes of between $80,000 to $100,000 County: Kings
Respondents who reported annual household incomes of between $80,000 to $100,000 County: Kings
8.3%
(2023)
Compared to:
Prior Value
(7.4%)
Prior Value compares a measured value with the previously measured value. Confidence intervals were not taken into account in determining the direction of the comparison.
Trend
This comparison measures the indicator’s values over multiple time periods.<br>The Mann-Kendall Test for Statistical Significance is used to evaluate the trend<br>over 4 to 10 periods of measure, subject to data availability and comparability.
Economy / Income
Respondents who reported annual household incomes of over $100,000
Value
Compared to:
Respondents who reported annual household incomes of over $100,000 County: Kings
Respondents who reported annual household incomes of over $100,000 County: Kings
11.1%
(2023)
Compared to:
Prior Value
(13.3%)
Prior Value compares a measured value with the previously measured value. Confidence intervals were not taken into account in determining the direction of the comparison.
Trend
This comparison measures the indicator’s values over multiple time periods.<br>The Mann-Kendall Test for Statistical Significance is used to evaluate the trend<br>over 4 to 10 periods of measure, subject to data availability and comparability.
Respondents whose household experienced a decrease in income County: Kings
Respondents whose household experienced a decrease in income County: Kings
59.1%
(2023)
Compared to:
No Comparison Data Available
(0%)
Respondents whose household experienced an increase in income County: Kings
Respondents whose household experienced an increase in income County: Kings
40.9%
(2023)
Compared to:
No Comparison Data Available
(0%)
Economy / Investment & Personal Finance
Economy / Investment & Personal Finance
Respondents who need assistance with household budgeting
Value
Compared to:
Respondents who need assistance with household budgeting County: Kings
Respondents who need assistance with household budgeting County: Kings
16.1%
(2023)
Compared to:
Prior Value
(10.0%)
Prior Value compares a measured value with the previously measured value. Confidence intervals were not taken into account in determining the direction of the comparison.
Education
Respondents who need assistance with education support County: Kings
Respondents who need assistance with education support County: Kings
7.9%
(2023)
Compared to:
Prior Value
(6.8%)
Prior Value compares a measured value with the previously measured value. Confidence intervals were not taken into account in determining the direction of the comparison.
Respondents who need assistance with tutoring County: Kings
Respondents who need assistance with tutoring County: Kings
3.6%
(2023)
Compared to:
Prior Value
(4.6%)
Prior Value compares a measured value with the previously measured value. Confidence intervals were not taken into account in determining the direction of the comparison.
Education / Childcare & Early Childhood Education
Education / Childcare & Early Childhood Education
Respondents who feel affordability is a barrier preventing them from utilizing childcare
Value
Compared to:
Respondents who feel affordability is a barrier preventing them from utilizing childcare County: Kings
Respondents who feel affordability is a barrier preventing them from utilizing childcare County: Kings
26.9%
(2023)
Compared to:
No Comparison Data Available
(0%)
Education / Childcare & Early Childhood Education
Respondents who feel childcare is affordable
Value
Compared to:
Respondents who feel childcare is affordable County: Kings
Respondents who feel childcare is affordable County: Kings
78.9%
(2023)
Compared to:
Prior Value
(43.0%)
Prior Value compares a measured value with the previously measured value. Confidence intervals were not taken into account in determining the direction of the comparison.
Education / Childcare & Early Childhood Education
Respondents who feel location is a barrier preventing them from utilizing childcare
Value
Compared to:
Respondents who feel location is a barrier preventing them from utilizing childcare County: Kings
Respondents who feel location is a barrier preventing them from utilizing childcare County: Kings
15.2%
(2023)
Compared to:
No Comparison Data Available
(0%)
Education / Childcare & Early Childhood Education
Respondents who feel operational hours is a barrier preventing them from utilizing childcare
Value
Compared to:
Respondents who feel operational hours is a barrier preventing them from utilizing childcare County: Kings
Respondents who feel operational hours is a barrier preventing them from utilizing childcare County: Kings
23.5%
(2023)
Compared to:
No Comparison Data Available
(0%)
Education / Childcare & Early Childhood Education
Respondents who feel there are enough childcare options and locations
Value
Compared to:
Respondents who feel there are enough childcare options and locations County: Kings
Respondents who feel there are enough childcare options and locations County: Kings
75.8%
(2023)
Compared to:
Prior Value
(34.4%)
Prior Value compares a measured value with the previously measured value. Confidence intervals were not taken into account in determining the direction of the comparison.
