
Search for Indicators
Active Living
Indicator Gauge Icon Legend
Legend Colors
Red is bad, green is good, blue is not statistically different/neutral.
Compared to Distribution
 the value is in the best half of communities.
 the value is in the 2nd worst quarter of communities.
 the value is in the worst quarter of communities.
Compared to Target
 meets target;
  does not meet target.
Compared to a Single Value
 lower than the comparison value;
 higher than the comparison value;
 not statistically different from comparison value.
Trend

 non-significant change over time;
 significant change over time;
  no change over time.
Compared to Prior Value
 higher than the previous measurement period;
 lower than the previous measurement period;
 no statistically different change from previous measurement period.
Health / Physical Activity
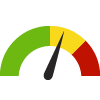
7th Grade Students who are Physically Fit County: Kings
7th Grade Students who are Physically Fit County: Kings
51.6%
(2018-2019)
Compared to:


CA Counties
The distribution is based on data from 58 California counties.
CA Value
(61.0%)
The regional value is compared to the California state value.
Prior Value
(47.9%)
Prior Value compares a measured value with the previously measured value. Confidence intervals were not taken into account in determining the direction of the comparison.
Trend
This comparison measures the indicator’s values over multiple time periods.<br>The Mann-Kendall Test for Statistical Significance is used to evaluate the trend<br>over 4 to 10 periods of measure, subject to data availability and comparability.
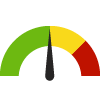
9th Grade Students who are Overweight or Obese County: Kings
9th Grade Students who are Overweight or Obese County: Kings
42.4%
(2018-2019)
Compared to:


CA Counties
The distribution is based on data from 58 California counties.
CA Value
(37.8%)
The regional value is compared to the California state value.
Prior Value
(43.1%)
Prior Value compares a measured value with the previously measured value. Confidence intervals were not taken into account in determining the direction of the comparison.
Trend
This comparison measures the indicator’s values over multiple time periods.<br>The Mann-Kendall Test for Statistical Significance is used to evaluate the trend<br>over 4 to 10 periods of measure, subject to data availability and comparability.
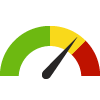
Access to Exercise Opportunities County: Kings
Access to Exercise Opportunities County: Kings
65.7%
(2024)
Compared to:

CA Counties
The distribution is based on data from 58 California counties.
U.S. Counties
The distribution is based on data from 3,096 U.S. counties and county equivalents.
CA Value
(94.2%)
The regional value is compared to the California state value.
US Value
(84.1%)
The regional value is compared to the national value.
Prior Value
(68.2%)
Prior Value compares a measured value with the previously measured value. Confidence intervals were not taken into account in determining the direction of the comparison.
Access to Parks County: Kings
Access to Parks County: Kings
43.1%
(2020)
Compared to:
CA Counties
The distribution is based on data from 58 California counties.
CA Value
(82.4%)
The regional value is compared to the California state value.
Prior Value
(34.0%)
Prior Value compares a measured value with the previously measured value. Confidence intervals were not taken into account in determining the direction of the comparison.
Adults 20+ who are Sedentary County: Kings
Adults 20+ who are Sedentary County: Kings
15.9%
(2021)
Compared to:

CA Counties
The distribution is based on data from 58 California counties.
U.S. Counties
The distribution is based on data from 3,074 U.S. counties and county equivalents.
Prior Value
(22.7%)
Prior Value compares a measured value with the previously measured value. Confidence intervals were taken into account in determining the direction of the comparison.
Trend
This comparison measures the indicator’s values over multiple time periods.<br>The Mann-Kendall Test for Statistical Significance is used to evaluate the trend<br>over 4 to 10 periods of measure, subject to data availability and comparability.
Adults Who Are Obese County: Kings
Adults Who Are Obese County: Kings
32.1%
(2022)
Compared to:
CA Counties
The distribution is based on data from 58 California counties.
CA Value
(28.8%)
The regional value is compared to the California state value.
US Value
(33.6%)
The regional value is compared to the national value. The source for the national value is Behavioral Risk Factor Surveillance System
Prior Value
(50.5%)
Prior Value compares a measured value with the previously measured value. Confidence intervals were taken into account in determining the direction of the comparison.
Trend
This comparison measures the indicator’s values over multiple time periods.<br>The Mann-Kendall Test for Statistical Significance is used to evaluate the trend<br>over 4 to 10 periods of measure, subject to data availability and comparability.
Adults who are Overweight or Obese County: Kings
Adults who are Overweight or Obese County: Kings
72.5%
(2022)
Compared to:
CA Counties
The distribution is based on data from 58 California counties.
CA Value
(62.3%)
The regional value is compared to the California state value.
US Value
(67.7%)
The regional value is compared to the national value. The source for the national value is Behavioral Risk Factor Surveillance System
Prior Value
(78.2%)
Prior Value compares a measured value with the previously measured value. Confidence intervals were taken into account in determining the direction of the comparison.
Trend
This comparison measures the indicator’s values over multiple time periods.<br>The Mann-Kendall Test for Statistical Significance is used to evaluate the trend<br>over 4 to 10 periods of measure, subject to data availability and comparability.
Adults Who Belong to a Fitness Club or Gym County: Kings
Adults Who Belong to a Fitness Club or Gym County: Kings
14.1%
(2023)
Compared to:


CA Value
(18.7%)
The regional value is compared to the California state value.
US Value
(16.0%)
The regional value is compared to the national value.
Prior Value
(15.2%)
Prior Value compares a measured value with the previously measured value. Confidence intervals were not taken into account in determining the direction of the comparison.
Adults who Follow a Regular Exercise Routine County: Kings
Adults who Follow a Regular Exercise Routine County: Kings
61.2%
(2023)
Compared to:
CA Counties
The distribution is based on data from 58 California counties.
CA Value
(69.3%)
The regional value is compared to the California state value.
US Value
(67.2%)
The regional value is compared to the national value.
Prior Value
(49.4%)
Prior Value compares a measured value with the previously measured value. Confidence intervals were not taken into account in determining the direction of the comparison.
Health / Physical Activity
Respondents who feel location is a barrier preventing them from utilizing local recreation activites
Value
Compared to:
Respondents who feel location is a barrier preventing them from utilizing local recreation activites County: Kings
Respondents who feel location is a barrier preventing them from utilizing local recreation activites County: Kings
36.2%
(2023)
Compared to:
No Comparison Data Available
(0%)
Health / Physical Activity
Respondents who stated there are adult sports teams in their community
Value
Compared to:
Respondents who stated there are adult sports teams in their community County: Kings
Respondents who stated there are adult sports teams in their community County: Kings
28.7%
(2023)
Compared to:

Prior Value
(31.2%)
Prior Value compares a measured value with the previously measured value. Confidence intervals were not taken into account in determining the direction of the comparison.
Trend
This comparison measures the indicator’s values over multiple time periods.<br>The Mann-Kendall Test for Statistical Significance is used to evaluate the trend<br>over 4 to 10 periods of measure, subject to data availability and comparability.
Health / Physical Activity
Respondents who stated there are bike paths in their community
Value
Compared to:
Respondents who stated there are bike paths in their community County: Kings
Respondents who stated there are bike paths in their community County: Kings
20.6%
(2023)
Compared to:
Prior Value
(28.1%)
Prior Value compares a measured value with the previously measured value. Confidence intervals were not taken into account in determining the direction of the comparison.
Health / Physical Activity
Respondents who stated there are community gardens in their community
Value
Compared to:
Respondents who stated there are community gardens in their community County: Kings
Respondents who stated there are community gardens in their community County: Kings
30.5%
(2023)
Compared to:
Prior Value
(26.9%)
Prior Value compares a measured value with the previously measured value. Confidence intervals were not taken into account in determining the direction of the comparison.
Health / Physical Activity
Respondents who stated there are fitness classes in their community
Value
Compared to:
Respondents who stated there are fitness classes in their community County: Kings
Respondents who stated there are fitness classes in their community County: Kings
35.7%
(2023)
Compared to:
Prior Value
(49.2%)
Prior Value compares a measured value with the previously measured value. Confidence intervals were not taken into account in determining the direction of the comparison.
Health / Physical Activity
Respondents who stated there are gyms in their community
Value
Compared to:
Respondents who stated there are gyms in their community County: Kings
Respondents who stated there are gyms in their community County: Kings
48.6%
(2023)
Compared to:
Prior Value
(71.2%)
Prior Value compares a measured value with the previously measured value. Confidence intervals were not taken into account in determining the direction of the comparison.
Trend
This comparison measures the indicator’s values over multiple time periods.<br>The Mann-Kendall Test for Statistical Significance is used to evaluate the trend<br>over 4 to 10 periods of measure, subject to data availability and comparability.
Health / Physical Activity
Respondents who stated there are libraries in their community
Value
Compared to:
Respondents who stated there are libraries in their community County: Kings
Respondents who stated there are libraries in their community County: Kings
57.3%
(2023)
Compared to:
Prior Value
(81.1%)
Prior Value compares a measured value with the previously measured value. Confidence intervals were not taken into account in determining the direction of the comparison.
Health / Physical Activity
Respondents who stated there are performing arts in their community
Value
Compared to:
Respondents who stated there are performing arts in their community County: Kings
Respondents who stated there are performing arts in their community County: Kings
23.3%
(2023)
Compared to:
Prior Value
(14.9%)
Prior Value compares a measured value with the previously measured value. Confidence intervals were not taken into account in determining the direction of the comparison.
Health / Physical Activity
Respondents who stated there are playgrounds in their community
Value
Compared to:
Respondents who stated there are playgrounds in their community County: Kings
Respondents who stated there are playgrounds in their community County: Kings
62.8%
(2023)
Compared to:
Prior Value
(83.9%)
Prior Value compares a measured value with the previously measured value. Confidence intervals were not taken into account in determining the direction of the comparison.
Trend
This comparison measures the indicator’s values over multiple time periods.<br>The Mann-Kendall Test for Statistical Significance is used to evaluate the trend<br>over 4 to 10 periods of measure, subject to data availability and comparability.
Health / Physical Activity
Respondents who stated there are skate parks in their community
Value
Compared to:
Respondents who stated there are skate parks in their community County: Kings
Respondents who stated there are skate parks in their community County: Kings
42.3%
(2023)
Compared to:
Prior Value
(59.5%)
Prior Value compares a measured value with the previously measured value. Confidence intervals were not taken into account in determining the direction of the comparison.
Health / Physical Activity
Respondents who stated there are splash pads in their community
Value
Compared to:
Respondents who stated there are splash pads in their community County: Kings
Respondents who stated there are splash pads in their community County: Kings
27.5%
(2023)
Compared to:
Prior Value
(33.1%)
Prior Value compares a measured value with the previously measured value. Confidence intervals were not taken into account in determining the direction of the comparison.
Health / Physical Activity
Respondents who stated there are sports features in their community
Value
Compared to:
Respondents who stated there are sports features in their community County: Kings
Respondents who stated there are sports features in their community County: Kings
39.4%
(2023)
Compared to:
Prior Value
(60.3%)
Prior Value compares a measured value with the previously measured value. Confidence intervals were not taken into account in determining the direction of the comparison.
Health / Physical Activity
Respondents who stated there are swimming pools in their community
Value
Compared to:
Respondents who stated there are swimming pools in their community County: Kings
Respondents who stated there are swimming pools in their community County: Kings
37.8%
(2023)
Compared to:
Prior Value
(56.6%)
Prior Value compares a measured value with the previously measured value. Confidence intervals were not taken into account in determining the direction of the comparison.
Health / Physical Activity
Respondents who stated there are visual arts in their community
Value
Compared to:
Respondents who stated there are visual arts in their community County: Kings
Respondents who stated there are visual arts in their community County: Kings
17.6%
(2023)
Compared to:
Prior Value
(15.4%)
Prior Value compares a measured value with the previously measured value. Confidence intervals were not taken into account in determining the direction of the comparison.
Health / Physical Activity
Respondents who stated there are walking trails in their community
Value
Compared to:
Respondents who stated there are walking trails in their community County: Kings
Respondents who stated there are walking trails in their community County: Kings
28.9%
(2023)
Compared to:
Prior Value
(37.1%)
Prior Value compares a measured value with the previously measured value. Confidence intervals were not taken into account in determining the direction of the comparison.
Trend
This comparison measures the indicator’s values over multiple time periods.<br>The Mann-Kendall Test for Statistical Significance is used to evaluate the trend<br>over 4 to 10 periods of measure, subject to data availability and comparability.
Health / Physical Activity
Respondents who stated there are youth sports teams in their community
Value
Compared to:
Respondents who stated there are youth sports teams in their community County: Kings
Respondents who stated there are youth sports teams in their community County: Kings
49.7%
(2023)
Compared to:
Prior Value
(70.0%)
Prior Value compares a measured value with the previously measured value. Confidence intervals were not taken into account in determining the direction of the comparison.
Trend
This comparison measures the indicator’s values over multiple time periods.<br>The Mann-Kendall Test for Statistical Significance is used to evaluate the trend<br>over 4 to 10 periods of measure, subject to data availability and comparability.
Workers who Walk to Work County: Kings
Workers who Walk to Work County: Kings
1.5%
(2018-2022)
Compared to:

CA Counties
The distribution is based on data from 58 California counties.
U.S. Counties
The distribution is based on data from 3,133 U.S. counties and county equivalents.
CA Value
(2.4%)
The regional value is compared to the California state value.
US Value
(2.4%)
The regional value is compared to the national value.
Trend
This comparison measures the indicator’s values over multiple time periods.<br>The Mann-Kendall Test for Statistical Significance is used to evaluate the trend<br>over 4 to 10 periods of measure, subject to data availability and comparability.
